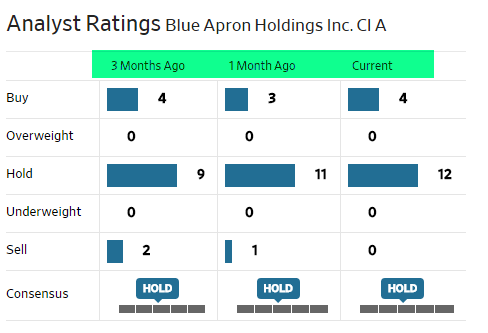
Hey, first, let’s do a little experiment to see if Wall Street analysts have become any better at their well-paying jobs. Let’s take, for instance, Blue Apron, and see what the boys had to say:

OK. Currently not a single “sell”, and a solid ‘Hold” for the entire available history. How’s the stock doing?
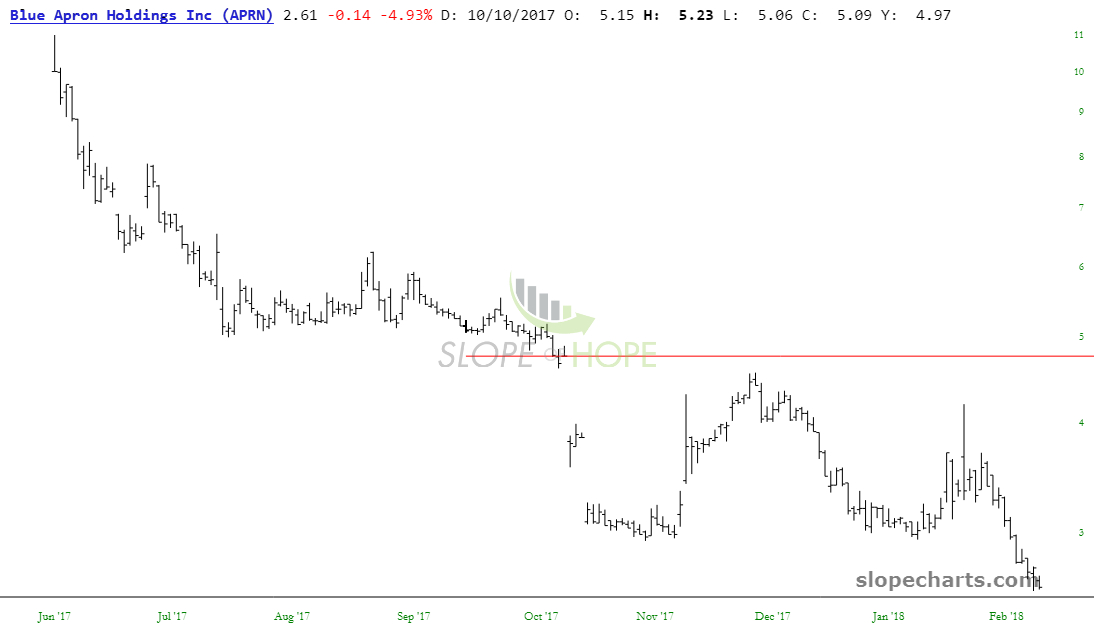
And there we have it. Conclusion: being a Wall Street “analyst” is the easiest job on the planet. Just say everything is a “Buy” (or, if it’s real toilet paper, a “Hold”) and collect a huge paycheck. Done! Some things never change.
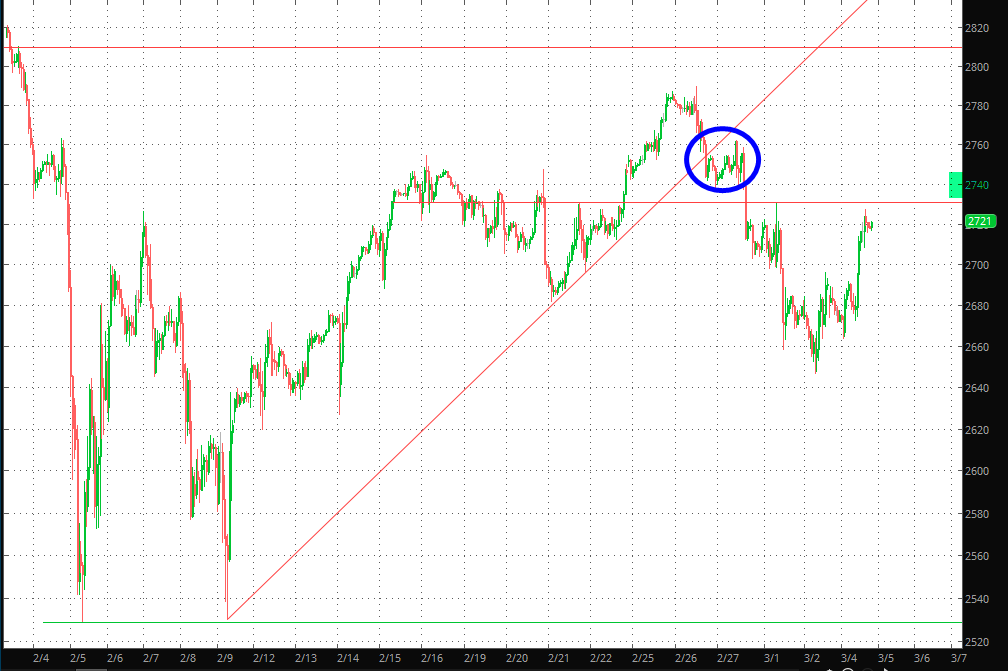
Anyway, volatility has come back into the market, but things still seem awfully muddled now. Last week we had a very important break (on an intraday basis) in the ES, circled below. However, we had a lot of “fight back” on Friday and yesterday (Monday). What started out as a nice weak day across the board reversed into a surge toward the horizontal drawn below. My mental “line in the sand” is about 2740 on the ES.
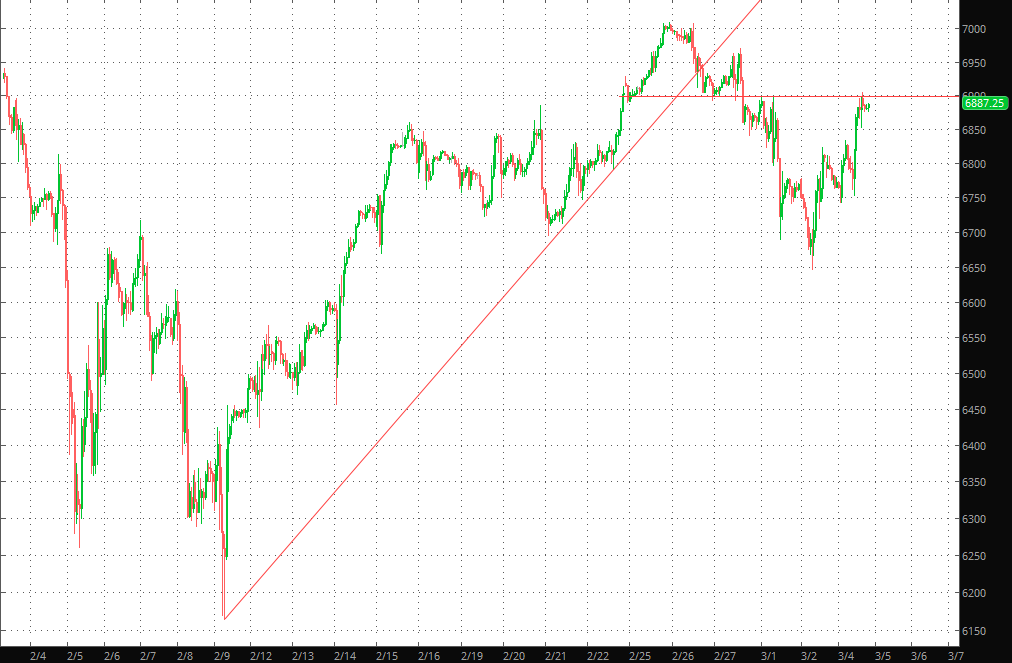
The NQ is similar, although it has been, on the whole, heartier (for one thing, Netflix is up way over 50% so far this year, which annualized is, what, about a 300% gain?) Here’s the NQ:
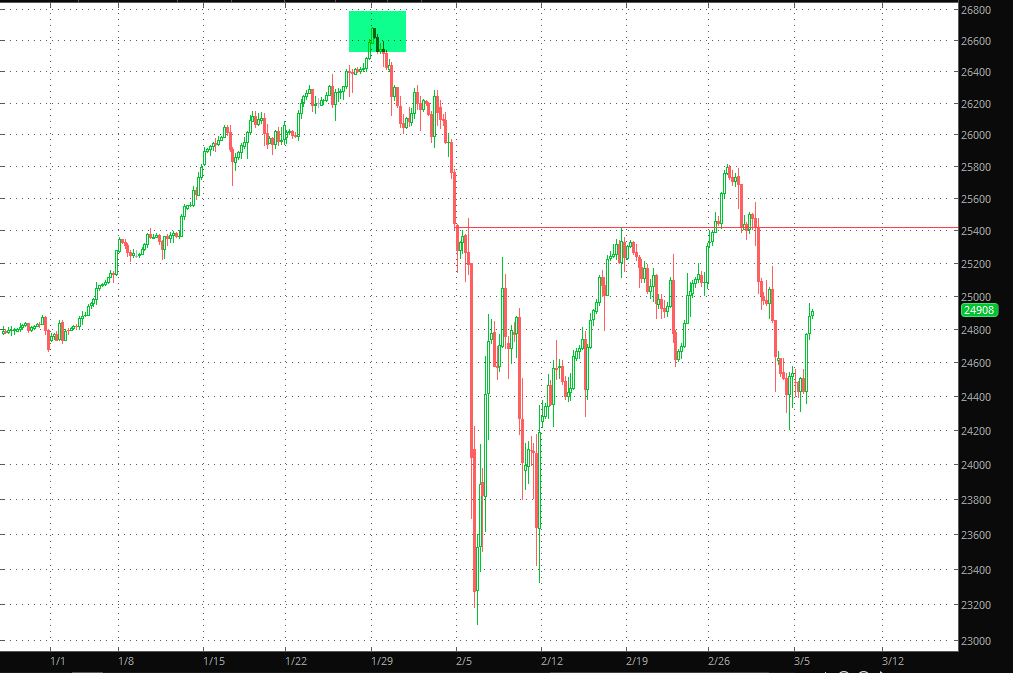
Taking a step back to see more data, we see on the YM (that is, the Dow 30 futures) where the market hit its ultimate peak (tinted in green), took its heavy, quick plunge, and then has been screwing around for the past few weeks. Here, too, is a fairly important horizontal which, if you don’t mind, I’d appreciate us staying below.
I’m pretty annoyed how strong the market was on Monday, but I’m still trying my best to be patient. I lightened up before last week was over, and I am in “only” 50 short positions now with a commitment of about 150%. Simply stated, looking at the chart below, it does not scream “bullish setup” to me.


Leave A Comment