
When it comes to market volatility, how low is low?
Before 2017, a close below 10 in the Volatility Index (VIX) was an extremely a rare event. It had only happened 9 times since 1990 out of 6,804 trading days. This is equivalent to 1 day every 3 years, or 0.13% of the time.
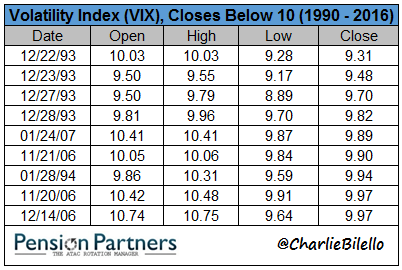
A handful of days in late December 1993, one day in January 1994, twice in November 2006, once in December 2006 and one more time in January 2007. After that, it would be over 10 years until the VIX would once again find itself below 10.
Which brings us to 2017: the year volatility died.
In 2017 alone, the Volatility Index has closed below 10 on 32 separate occasions, or 16% of all days. In the table below of lowest VIX closes, the sea of yellow is all since May of this year.
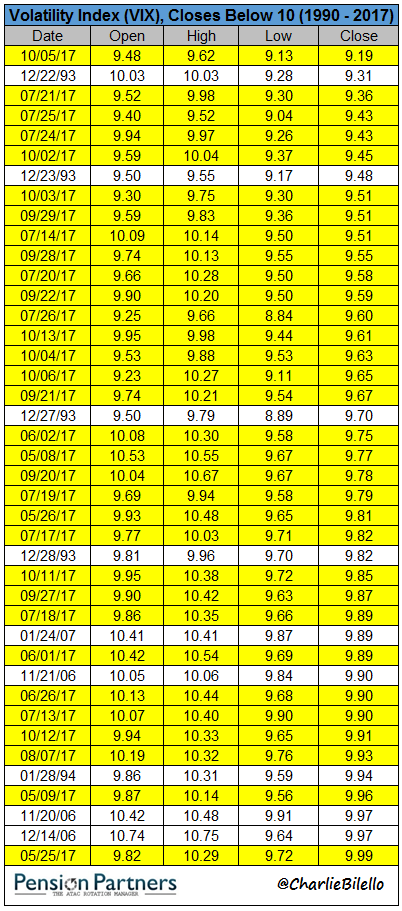
In 2017, we have seen the following records in the VIX:
October is known as the most volatile month in markets.
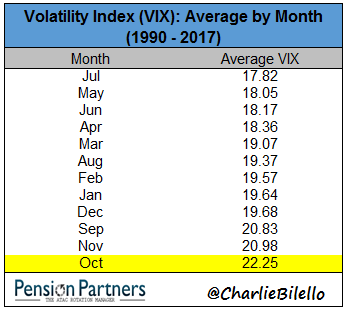
Not this year. October 2017 is on pace to be the least volatile month in modern history (back to 1990).

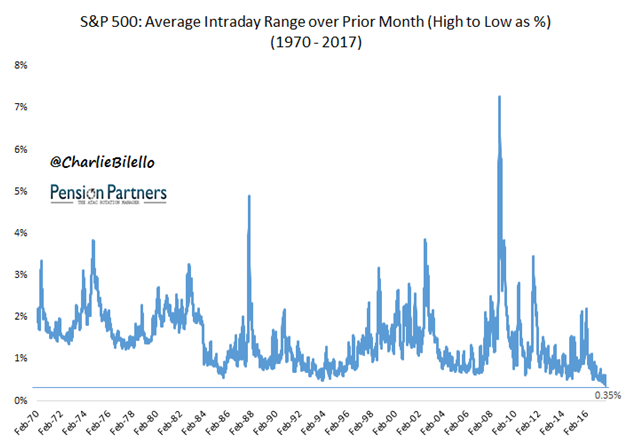
Intraday volatility over the past month is also at a record low, with a 0.35% average range. Just 9 years ago, in October 2008, that same range was over 7% per day.
What does this tell us other than the obvious (volatility is extremely low)?
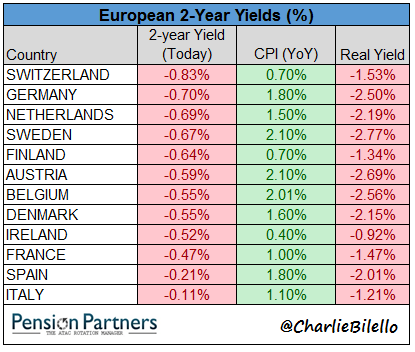
First, that records in markets are made to be broken. Just because you haven’t seen something before doesn’t mean it can’t happen. Given enough time, almost anything can and will happen. If you don’t believe me, see Exhibit A (negative interest rates across Europe)…
2017 also serves as a reminder that future is unknown. Nobody was predicting this to be the least volatile year in modern history. They were predicting just the opposite, in fact, even after the year had already begun…


Leave A Comment