Most Bitcoin charts tell you where the price of the cryptocurrency has been, but this Bitcoin price chart tells you where it’s going.
And it’s going higher – exponentially higher.
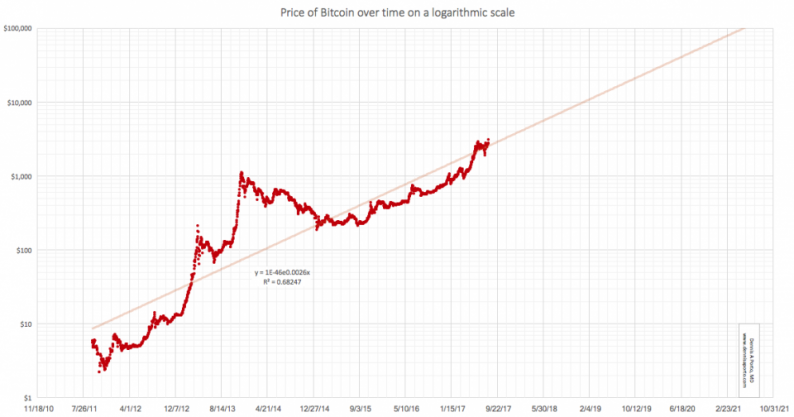
This chart makes a Bitcoin price prediction of $10,000 by December 2018, $20,000 by the fall of 2019, and $100,000 by mid-2021.
The chart plots the Bitcoin price from 2011 to the present using a logarithmic scale. Although it deviates from the mean often (and sometimes dramatically), the price of Bitcoin shows a pattern that will take it to $100,000 in just over four years.
Take a look:

That’s a gain of 2,280% from the current Bitcoin price of about $4,200.
This Bitcoin price chart is the brainchild of Dennis Porto, a dermatologist and a student of Management and Health Policy at Harvard University. Porto is a Bitcoin enthusiast who was just trying to make sense of the cryptocurrency’s stunning growth when he realized it mirrored a pattern he’d seen before…
A Bitcoin Price Chart Based on Moore’s Law
“I made the observation based on trying to imagine a world where Bitcoin is widespread,” Porto told Money Morning. “Then, I imagined the path it would take from today to this time when it is widespread.”
The chart shows that the Bitcoin price has doubled roughly every eight months. Right now, the price of Bitcoin is a bit ahead of schedule, with the chart suggesting it wouldn’t reach $4,000 until January 2018.
The concept of something doubling at a regular interval rang a bell with Porto, and it should also be familiar to longtime followers of the tech sector. It’s the essence of “Moore’s Law,” an observation made by Intel Corp. (Nasdaq: INTC) founder and CEO Gordon Moore in 1965.
Moore noted that the number of transistors per square inch on integrated circuits doubles approximately every 18 months, making computing devices exponentially more powerful over time.


Leave A Comment