Many traders and investors have been unnerved by the stock market’s recent price action. This is understandable, with the S&P 500’s futures going up and down 1-2% every single day on the intraday.

Such high volatility is typical of the final 8-12 months before the bull market tops.
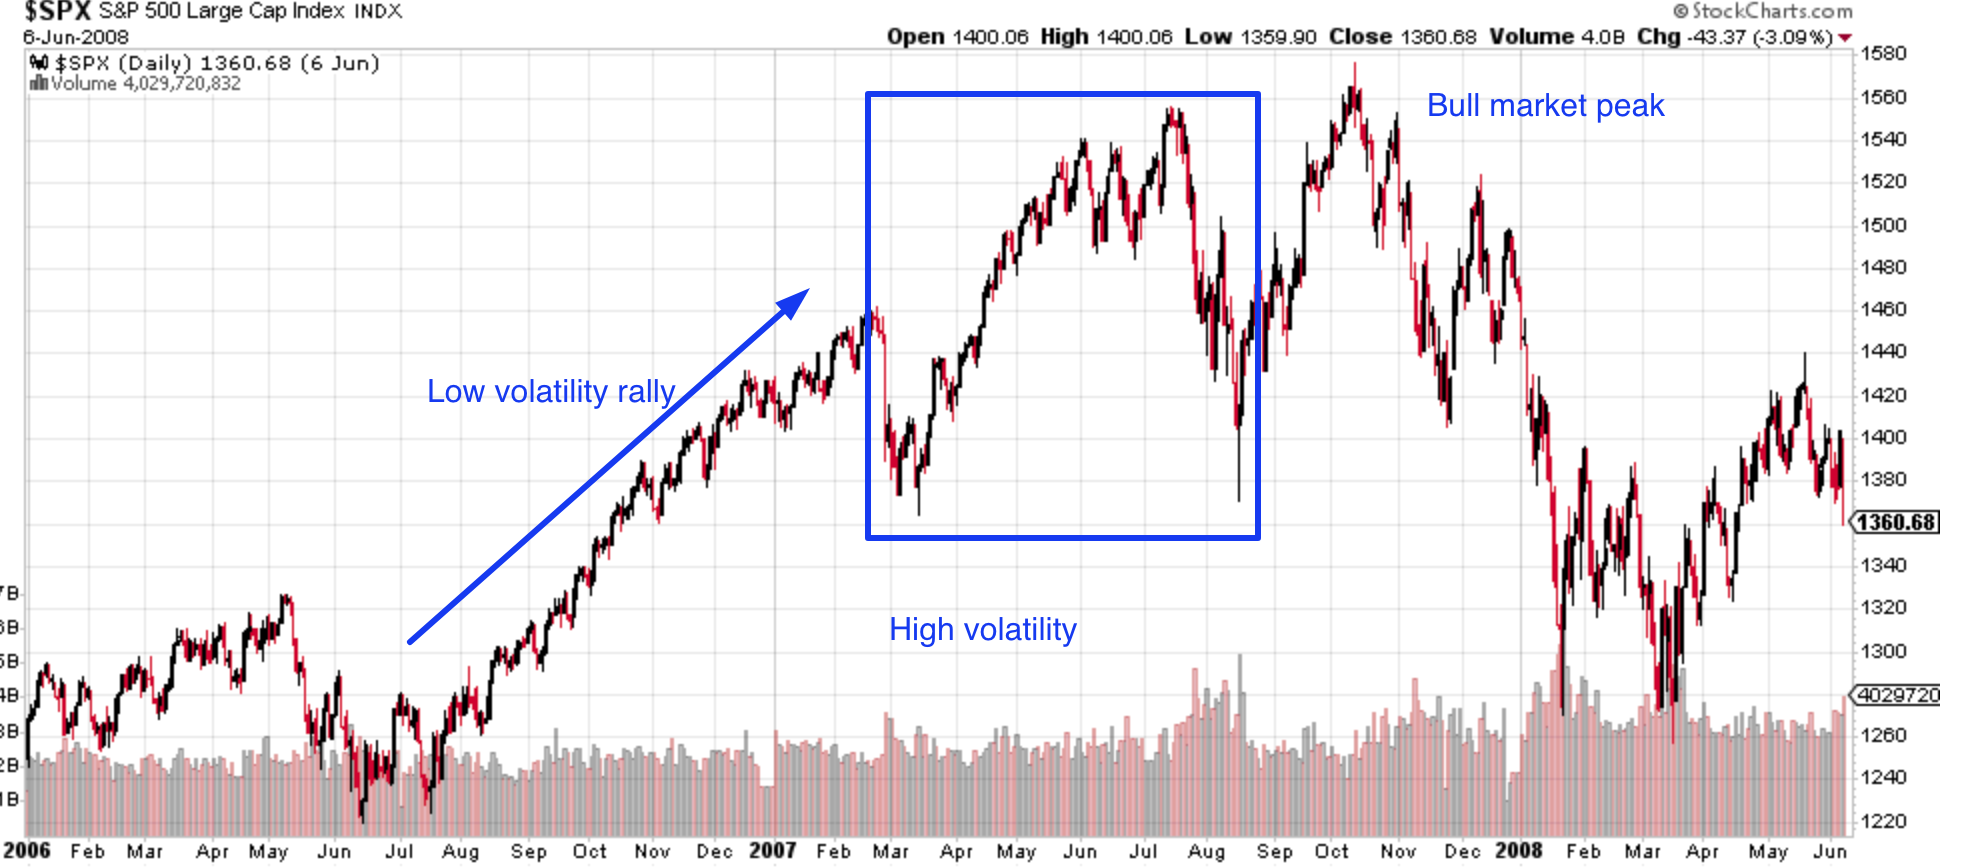
Here’s the October 2007 top.
Here’s the March-September 2000 top.

The U.S. stock market’s current correction particularly reminds me of the July – August 2007 correction. It was a rather large “small correction” of 10-12%. It was also very short (i.e. approximately 1 month), with LOTS OF VOLATILITY.
But sure enough, the first sign of high volatility was not the end of the bull market.
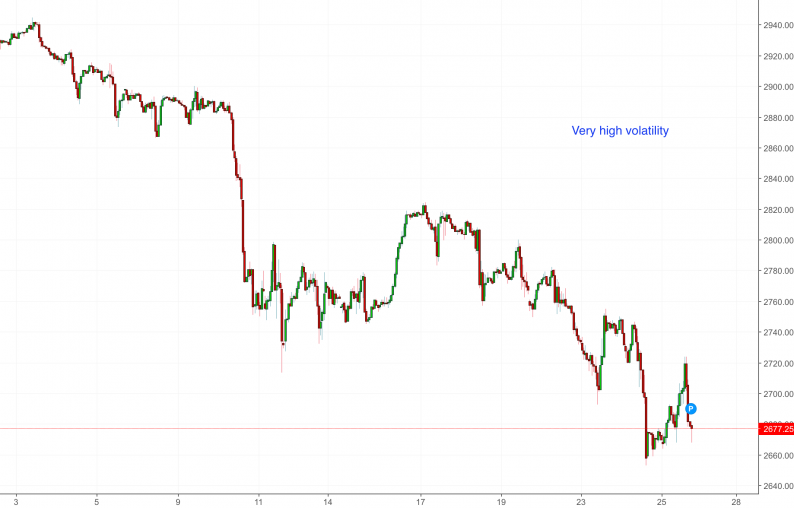
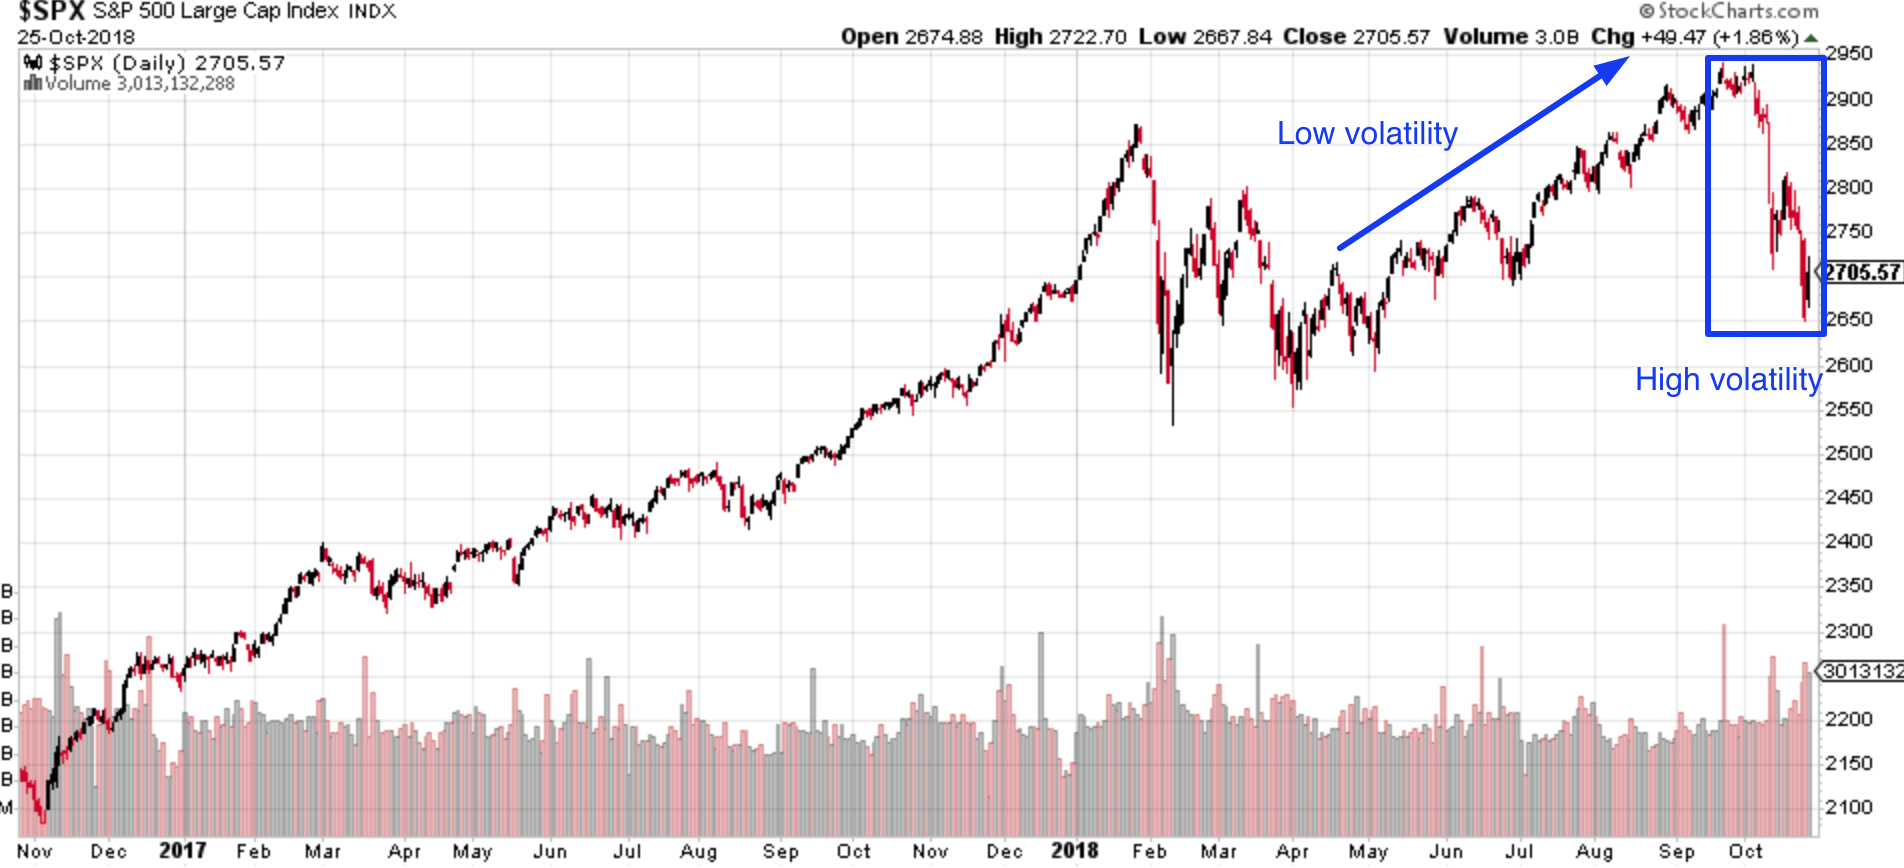
Here’s the S&P 500 right now.
Here’s what you should do during periods of high volatility.
Here are more signs that the U.S. stock market’s medium term outlook is bullish (ontop of the other recent signs)
*Let’s analyze the stock market’s price action by quantifying technical analysis. For the sake of reference, here’s the random probability of the U.S. stock market going up on any given day, week, or month.


Leave A Comment