
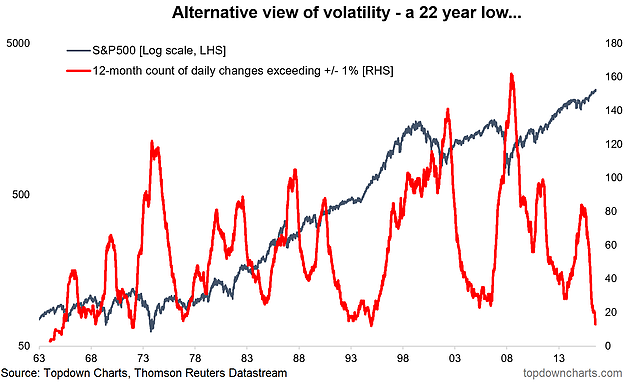
On a range of trends and topics these are unusual times we live in, and stock market volatility is no exception. As a matter of fact, market volatility in general is very low i.e. across asset classes, as discussed in the latest weekly report. Yet here is a somewhat unusual measure of volatility, which is coming in at a 22-year low. The indicator (red line in the first chart below) shows the running annual count of daily changes in the S&P500 that exceeded positive or negative 1%. To clarify, if the market was up e.g. 1.3% that would be counted, likewise if the market was down -1.4% for example it would also be counted.
Up to Friday’s close, the past year had precisely 13 days where the S&P 500 moved by more than 1% in either direction. It was very briefly lower than that in December 1995. So it’s fair to say that based on this alternative view that volatility is extremely low. But so what? Well, typically when it gets this extremely low it doesn’t stay low for long, but this measure of volatility can rise in a more euphoric/erratic bull market (e.g. the late 90’s) or a bear market (e.g. leading into the financial crisis). Either way it’s one to have on your radar as a turn in this indicator can give a lead on a change in market regime.
The running annual count of daily moves in the S&P 500 exceeding +/- 1% has dropped to 13, which is the lowest reading in 22 years, and is indicative of extremely low volatility.
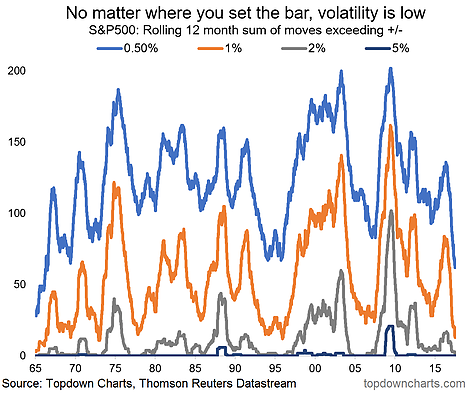
Even if you look at the same indicator using a threshold of 0.50% volatility looks low – in fact with that criteria you have to go back to the 60’s to find lower levels of volatility.


Leave A Comment