
Similar to some better-known factors like size and value, time-series momentum is a factor which has historically demonstrated above-average excess returns. Time-series momentum, also called trend momentum or trend-following, is measured by a portfolio which is long assets which have had recent positive returns and short assets which have had recent negative returns.(1) Compare this to the traditional (cross-sectional) momentum factor, which considers recent asset performance only relative to other assets. The academic evidence suggests that inclusion of a strategy targeting time-series momentum in a portfolio improves the portfolio’s risk-adjusted returns. Strategies that attempt to capture the return premium offered by time-series momentum are often called, “managed futures,” as they take long and short positions in assets via futures markets — ideally in a multitude of futures markets around the globe. This piece dives into time-series momentum and examines some of its specific qualities — qualities that make a managed futures strategy a good portfolio diversifier (example shown here).
In general, an asset that has low (or negative) correlation with broad stocks and bonds provides good diversification benefits. Low or near-zero correlation between two assets means that there is no relationship in their performance: Asset A performing above average does not tell us anything about Asset B’s expected performance relative to its average. The addition of a low-correlation asset to a portfolio will, depending on the specific return and volatility properties of the asset, improve the portfolio’s risk-adjusted returns either by improving the portfolio’s return, reducing the portfolio’s volatility, or both.
An Introduction to Time Series Momentum Research
AQR Capital Management’s Brian Hurst, Yao Hua Ooi and Lasse H. Pedersen contribute to the literature on time-series momentum with their June 2017 study, A Century of Evidence on Trend-Following Investing”— an update of their 2014 study, “Time Series Momentum.” They constructed an equal-weighted combination of one-month, three-month and 12-month time-series momentum strategies for 67 markets across four major asset classes (29 commodities, 11 equity indices, 15 bond markets and 12 currency pairs) from January 1880 to December 2016. For each of the three strategies (one-, three- and 12-month), the position taken in each market is determined by assessing the past return in that market over the relevant look-back horizon. A positive past excess return is considered an “up” trend and leads to a long position; a negative past excess return is considered a “down” trend and leads to a short position. Each position is sized to target the same amount of volatility, both to provide diversification and to limit the portfolio risk from any one market (see risk parity for dummies). The positions across the three strategies are aggregated each month and scaled such that the combined portfolio has an annualized ex-ante volatility target of 10 percent. Volatility scaling ensures that the combined strategy targets a consistent amount of risk over time, regardless of the number of markets that are traded at each point in time. Their results include implementation costs based on estimates of trading costs in the four asset classes. They further assumed management fees of 2 percent of asset value and 20 percent of profits, a traditional fee for hedge funds.
Below is a recap of the authors’ Time Series managed futures strategy versus a long-only strategy trading the same futures contracts.
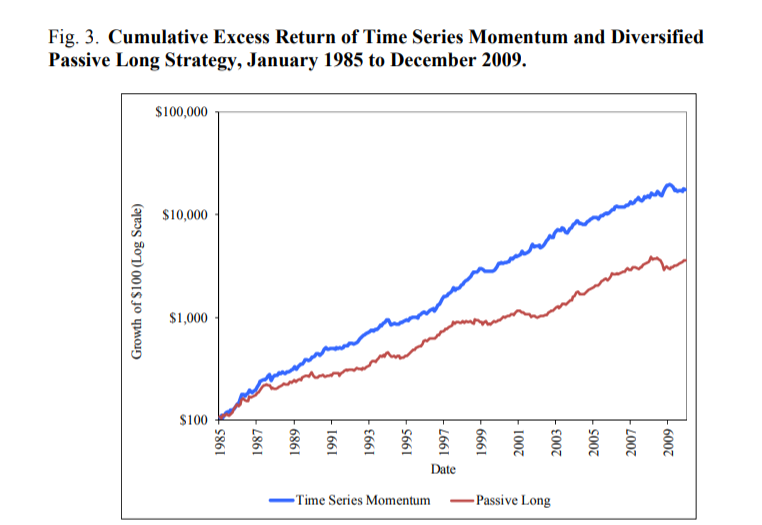
The results are hypothetical results and are NOT an indicator of future results and do NOT represent returns that any investor actually attained. Indexes are unmanaged, do not reflect management or trading fees, and one cannot invest directly in an index. Additional information regarding the construction of these results is available upon request.
The following is a summary of the AQR researchers’ findings:


Leave A Comment