Whip saw price action yesterday that saw an initial sell-off, followed by the dip buyers coming in and pushing the market higher throughout the afternoon.
Overall the volume was extremely light and well below average levels.
The doji candle that is shown on SPX marks indecision by the market between buyers and sellers and could signal that the dead cat bounce has topped out and a potential retest of 1812 is a strong possibility.
SPX/SPY retested the 20-day moving average yesterday and held onto this MA perfectly.
Short-term, the bulls are getting into overbought territory.
VIX dropped below 20 to 19.98 yesterday after falling 1% yesterday.
T2108 (% of stocks trading above the 40-day moving average) continues to form lower-highs currently and sitting at declining resistance that is formed off of the highs established back in November. Overall a quiet day for the indicator, dropping 1% down to 29.
If the bulls manage to rally the market again today, resistance looms heavy at the 1990-2000 level.
Oil dropped over 6% yesterday while SPX hovered in positive territory. This was the first time oil has not dragged the market lower on a huge sell-off. Some people are saying that oil and stocks are decoupling. That is far to early to say that and would need to see more similar price action in the coming days.
 Technical Outlook:
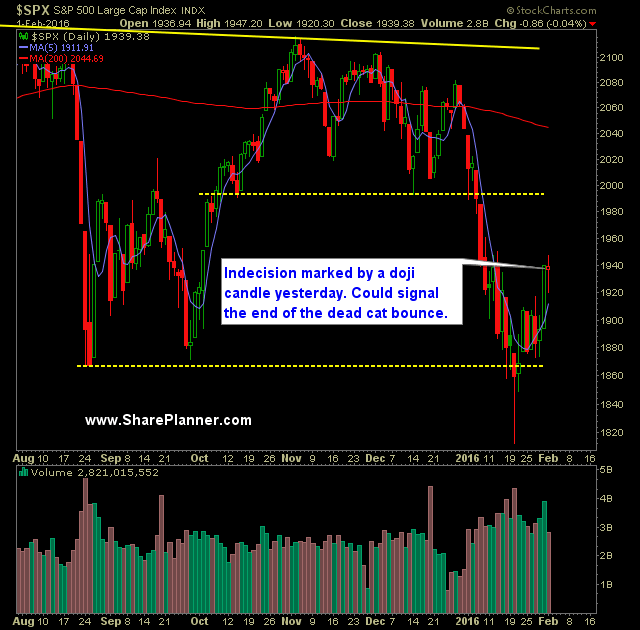


Leave A Comment