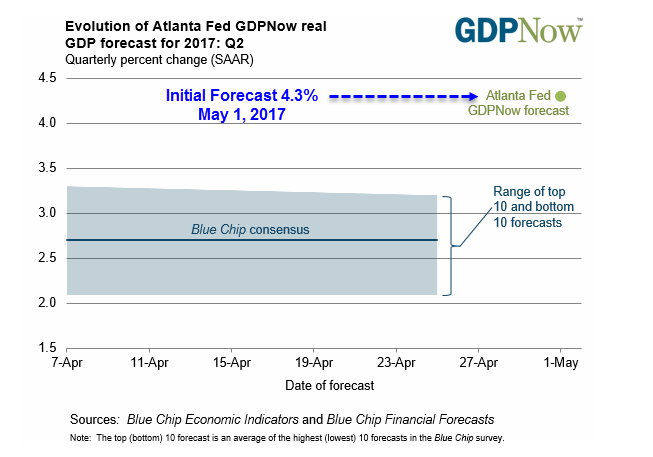
On May 1, the GDPNow Model came up with an initial forecast of 4.3% for second quarter GDP.
My first reaction was “here we go again”. That was quickly followed by “I’ll take the under, way under” bet.
Let’s take a look at the latest forecast, why I think the model is wrong, and some interesting charts of GDPNow forecasts vs what actually happened.

I emailed Pat Higgins, the creator of GDPNow about the initial forecast. He could not say too much because of an FOMC blackout, but here is his email.
Hi Mish,
The March growth rates for each of private permanent-site residential, private nonresidential, and state+local construction spending put in place were each lower than the model was predicting on April 27th in the final model nowcast for the first-quarter. But all three of these growth rates for February were revised up from the previous construction spending report. I can’t do a deeper analysis on the implications for the GDPNow forecast for the second quarter because of the blackout on FOMC communications until this Friday. Hope this helps a little though.
Best regards,
Pat
Weather Related GDP Again
Prior to seeing the initial GDPNow forecast I had emailed Pat my comment on construction spending: “The second quarter is not off to a good start. However, the GDP models may go haywire once again by not factoring in weather-related phenomenon.”
GDPnow Initial and Final Forecasts vs Actual
![]()
I created the above chart from the “tracking archives” spreadsheet from GDPNow downloadable data. I added a few columns (Initial, Final Actual) to the sheet.
My friends at Advisor Perspectives helped with data labels.
In the above chart, Actual means the Advance GDP estimate, not the final revised GDP number.
GDPNow Track Record
![]()
4.3% Really?
In Investigating Weather-Related Effects on Construction Spending I posted this chart that explains the jump in the initial GDPNow forecast.


Leave A Comment