![]()
Last week, I discussed the potential year-end setup for a January correction. To wit:
“It is the turn of the calendar where I see the potential for a bigger correction. Come January, I think there is a high-likelihood of ‘tax selling’ by fund-managers to lock in gains, particularly if ‘tax reform’ legislation has passed, as taxes won’t be due for 21-months (assuming late filing.)
That selling, combined with concerns over the Fed’s rate hike in December and reduction of the balance sheet, could facilitate a deeper correction of 3-5%.”
Chart updated through Friday
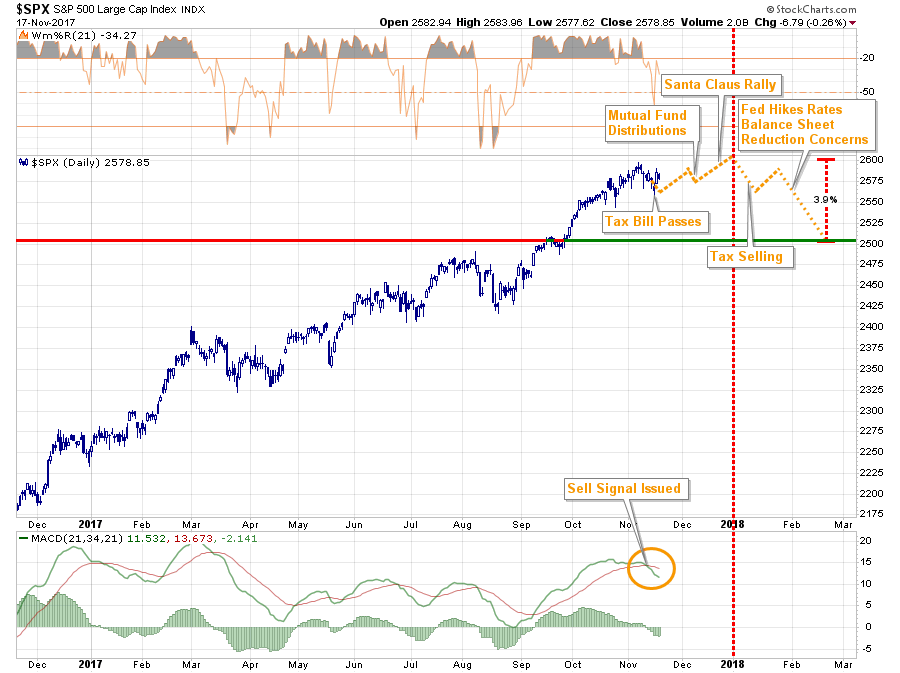
Two things occurred this past week:
This coming week is Thanksgiving week which is traditionally an extremely “light” trading period where the “inmates are running the asylum.” With the market more overbought now than at any other period since 2011, a consolidation or further corrective action is entirely possible.
While some “caution” is advised, it is NOT advisable to act “emotionally” to swings next week due to the low volume trading that will be occurring.
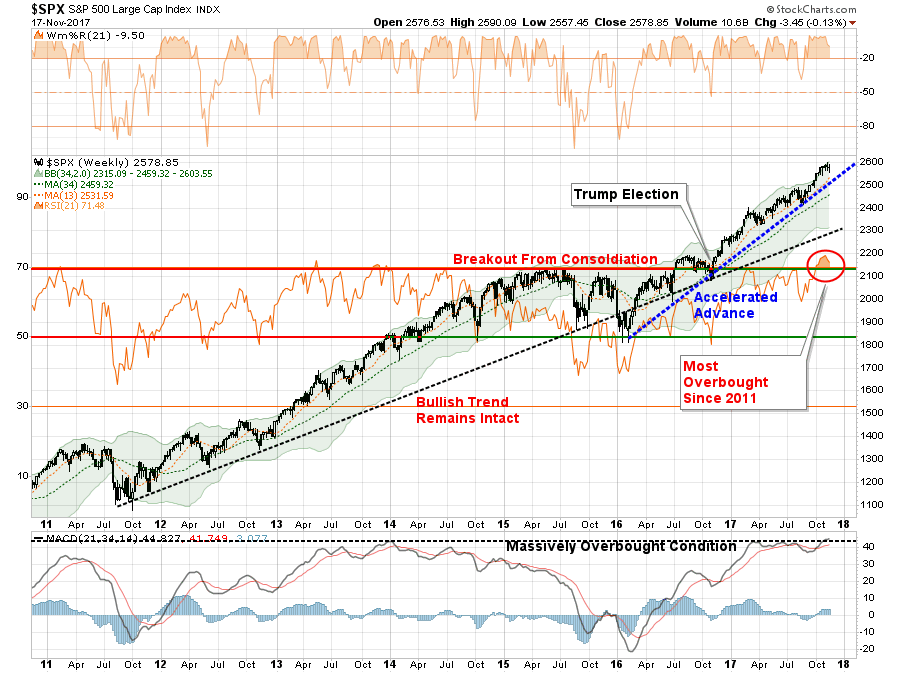
While the market is extremely overbought, the bullish trends remain intact. Furthermore, the last two months of the year are typically bullish for asset prices. Understanding this, these conditions keep portfolios allocated towards equity risk currently. But we do so with an eye on the risk.
Tracking The Bear
by Michael Lebowitz, CFA
In Bond Bears: Why Rates Won’t Rise Lance Roberts recently forecasted stable to lower bond yields in the months ahead. His argument is partially based upon a continuation of weak economic growth trends. To support the forecast he presented a graph of the 2s-10s yield curve, or the difference between 2-Year U.S. Treasury yields and 10-year U.S. Treasury yields.As shown below the yield curve tends to flatten and ultimately invert (10yr-yields become less than 2yr-yields thus the curve goes below zero) as economic activity wanes and recession becomes imminent.
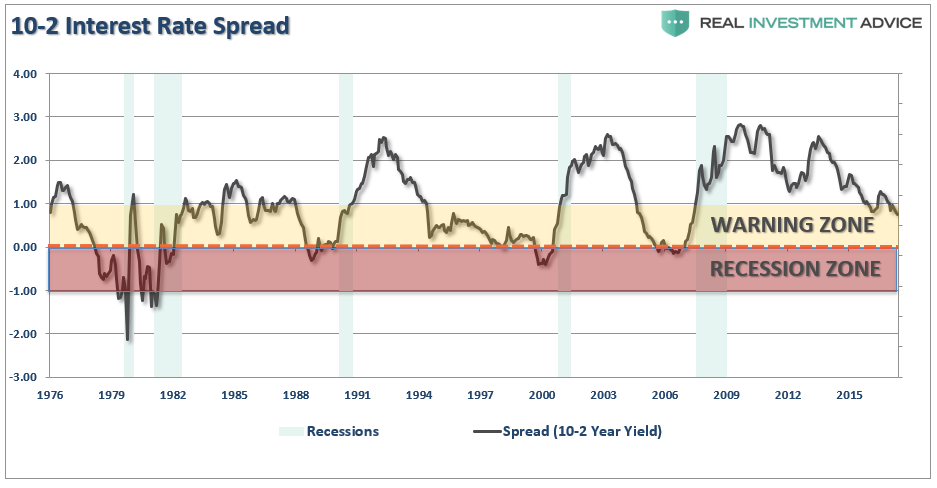
Currently, the 2s-10s curve sits in the “warning zone” and is at the lowest level since the financial crisis of 2008. This is possibly a sign that bond traders are concerned about future economic activity and if it continues to flatten, one that could spell trouble for the equity markets.
It is said stocks take the stairs up and the elevator down. That is a nice way of saying that when a market peaks it tends to fall much more impulsively than it rose. Prior to the last market correction (2008), the S&P 500 rose steadily for over five years. Those gains and more were erased in less than two years with the majority of losses coming between September and November 2008, when 41% of the index was wiped out.
Junk Debt
If we assume the next sell-off in stocks, like the previous few, will not be a gradual decline but a sharp drop lower, we must remain alert to signals that precede trend changes. The importance today is every bit as important as in 1999 and 2007, given that valuations stand at or near all-time highs and the risks of significant losses are potentially on par with loses in those periods. The yield curve is one such signal we should follow as recession tends to accompany lower stock prices.
Another such warning worth watching closely is the recent divergence between high yield debt and the S&P 500.
High yield debt, also known as junk bonds, are the publicly traded debt of companies rated as below investment grade (BB+/Ba1 or below). Simply, they have a higher level of default risk than investment grade bonds. It is because of this credit risk that some investors consider them a hybrid between equity and bonds. The higher yields offered by junk-rated companies and their tendency for greater price volatility makes their total returns more similar with equity returns than Investment-grade corporate debt and U.S. Treasuries. Investors of junk debt tend to do similar fundamental analysis as equity investors.


Leave A Comment