
Not Getting Better
In late July last year, not long before the stock market delivered a major “warning shot” with its sharp decline in August, we wrote about the transportation sector in Transportation Sector in Trouble – What are the Implications? As we noted at the time, the sector seemed to send a potential “economic red alert”.

The famous ghost fleet near Singapore. Photo credit: Richard Jones / Sinopix
What was at the time a long-lasting divergence between the Dow Jones Industrial and Transportation Averages, has in the meantime turned into a complete rout of transportation stocks. At the moment the Transportation Average is rebounding from severe oversold conditions, but the fact remains that this former upside leader has become a downside leader.
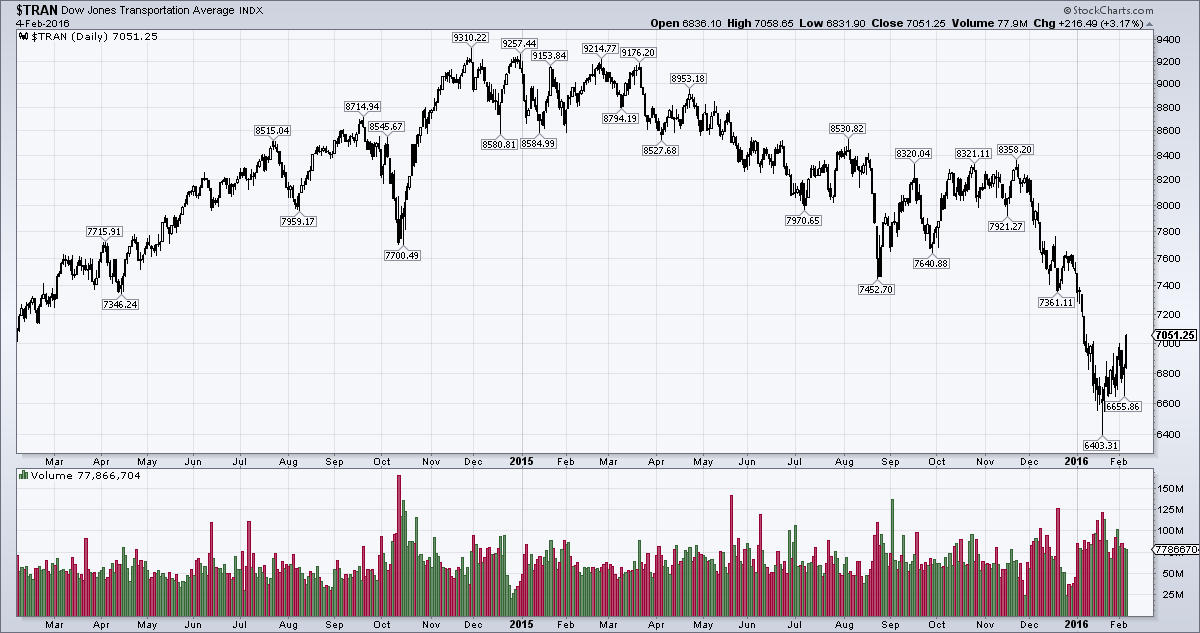
After topping in late 2014, the Dow Transportation Average has suffered a sharp decline – click to enlarge.
In recent days we have come across a few other data points and charts in this context, some of which we show below. Yesterday Zerohedge reported on a sharp decline in orders for trucks, which jibes with what we are seeing elsewhere.
The charts below are a bit of an eclectic collection, but they are all making the same point: global trade continues to be in trouble. First two charts from China, the first one of which we have already shown in a recent Bill Bonner missive, namely the Shanghai containerized freight index (a price index).
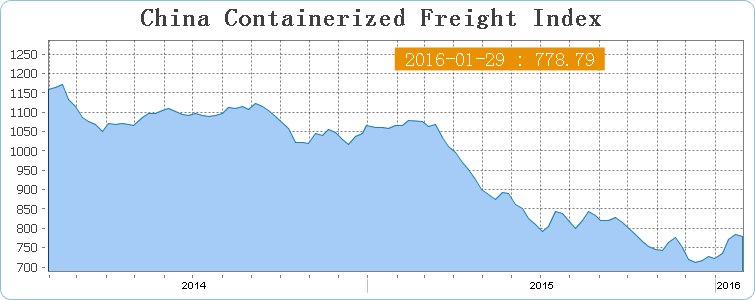
China containerized freight index has been in a relentless downtrend last year. Lately it has been moving sideways at a low level – click to enlarge.
The next chart shows the China railway freight index. Apparently China’s national railway company is set to reports its first ever operating loss this year, as railway cargo volumes have collapsed 11.9% year-on-year in 2015 to a new five year low. In Q4 2015 the decline accelerated to 13.4% y/y.

China’s railway freight index – at a five year low.


Leave A Comment