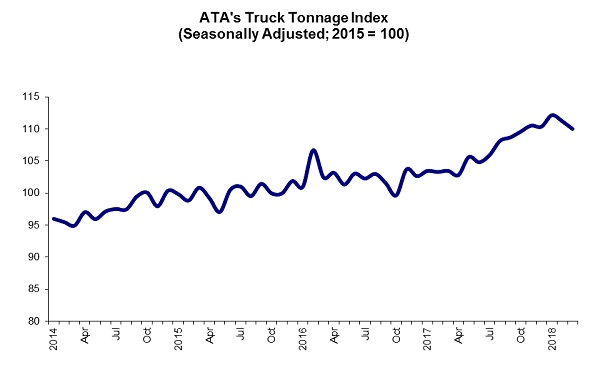
Headline data for truck shipments improved in July.
ATA Trucking
American Trucking Associations’ advanced seasonally adjusted (SA) For-Hire Truck Tonnage Index increased 0.1% in July, following a 4.4% drop during June. In July, the index equaled 138.5 (2000=100), up from 138.4 in June. Said ATA Chief Economist Bob Costello:
July’s small increase in truck tonnage fits with other mixed economic indicators. Retail sales surprised to the upside, but manufacturing production and housing starts were down, so combined those likely caused a rather flat month in July for truck tonnage.
With better economic growth in the second half of 2017, expect truck tonnage to continue increasing at a moderate pace on a year-over-year basis.
ATA Truck tonnage this month

Compared with July 2016, the SA index increased 2.3%. In June, the index rose 1.2% on a year-over-year basis. Year-to-date, compared with the same seven months in 2016, the index is up 1.2%.
Econintersect tries to validate ATA truck data across data sources. It appears this month that jobs growth says the trucking industry employment levels were marginally improved month-over-month. Please note using BLS employment data in real time is risky, as their data is normally backward adjusted (sometimes significantly).
This data series is not transparent and therefore cannot be relied on. Please note that the ATA does not release an unadjusted data series (although they report the unadjusted value each month – but do not report revisions to this data) where Econintersect can make an independent evaluation. The data is apparently subject to significant backward revision. Not all trucking companies are members of the ATA, and therefore it is unknown if this data is a representative sampling of the trucking industry.
source: ATA
CASS FREIGHT INDEX REPORT
Both the Shipments and Expenditures Indexes extended their run of positive comparisons. Shipments turned positive eight months ago, while Expenditures turned positive seven months ago. In part because of normal seasonality, and in part because of more difficult comparisons, they were less strong in July. Throughout the U.S. economy, we are continuing to see a growing number of data points suggesting that the economy continues to get incrementally better. Some data points are simply less bad, a few of them are much better (airfreight, DAT Barometer), but some are suggesting deceleration (rail). The 1.4% YoY increase in the July Cass Shipments Index is yet another data point which confirms that the first positive indication in October (before the election) was a change in trend. In fact, it now looks as if the October 2016 Cass Shipments Index, which broke a string of 20 months in negative territory, was one of the first indications that a recovery in freight had begun.


Leave A Comment