
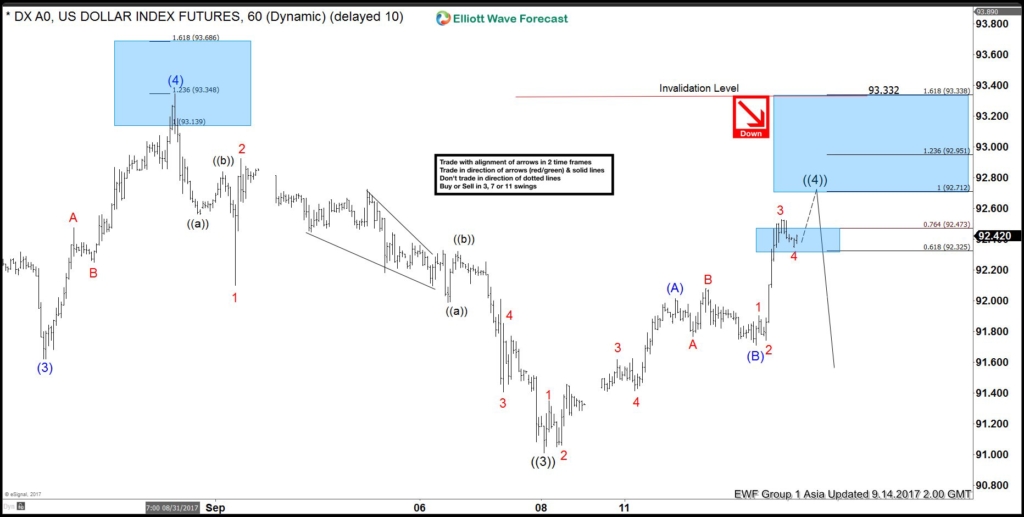
Short-term Elliott Wave view suggests that the US Dollar Index ended Primary wave ((3)) at 91.01 and currently in a Primary wave ((4)) bounce. Internal of Primary wave ((4)), it is unfolding as a zigzag Elliott wave structure. Preferred view suggests a rally to 92.01 completed Intermediate wave (A) and a dip to 91.71 in an ended Intermediate wave (B) as an expanded Elliott wave FLAT. Expect the Index to continue higher towards 92.71 – 92.95 area to complete Primary wave ((4)). Afterwards, the Index should resume the decline lower or at least pullback in 3 waves. We don’t like buying the Dollar Index. Expect sellers to appear at 92.71 – 93.33 area for a 3 waves reaction lower at least. If the rally in the Dollar Index extends beyond 93.33 (1.168 extension), the move from 9/8 low could unfold as impulse instead.
DXY 1 Hour Elliott Wave Chart
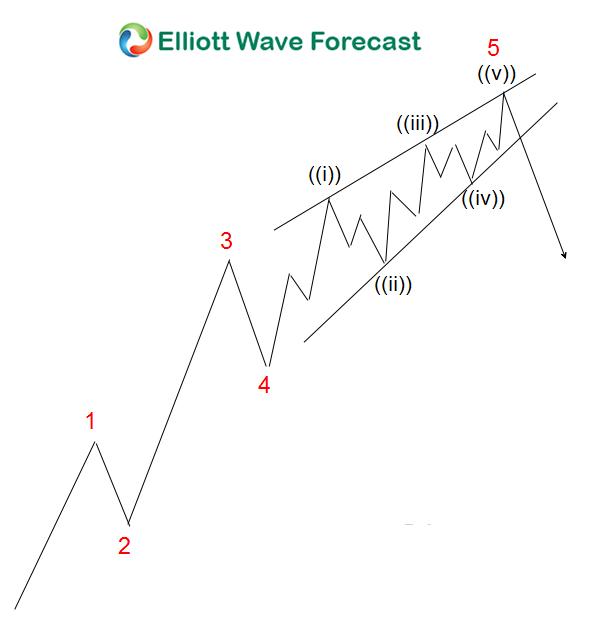
Ending Diagonal is an Elliott wave structure that typically happens inside wave 5 of an impulse or inside wave C of a zigzag. Ending Diagonal has 5 waves subdivision and each wave is further subdivided into 3 waves. Thus Ending Diagonal has the structure of 3-3-3-3-3. When Ending Diagonal happens within wave 5, the internal wave 1 of 5 and wave 4 of 5 can overlap. The Ending diagonal also often forms a wedge shape.


Leave A Comment