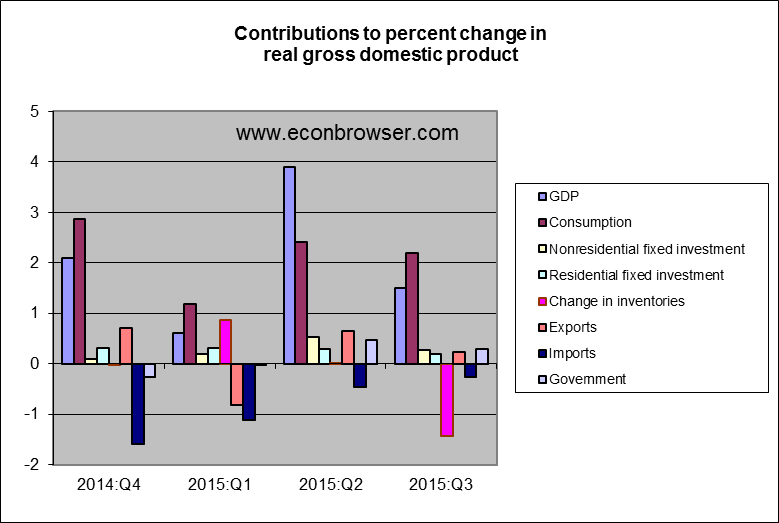
The Bureau of Economic Analysis announced yesterday that U.S. real GDP grew at a 1.5% annual rate in the third quarter. Although the headline number sounds disappointing, the underlying fundamentals look solid.
It was encouraging that housing, nonresidential investment, and the government sector all made positive contributions. The one negative was a drawdown in inventories (goods sold but not produced during the quarter). Leaving inventories out, real final sales grew at a healthy 3% annual rate.

With the BEA now estimating that real GDP grew in the second quarter at a 3.9% annual rate, the latest reading for the Econbrowser Recession Indicator Index eased down to 5.6%, unambiguously signaling an ongoing economic expansion. The index uses yesterday’s data release to form a picture of where the economy stood as of the end of 2015:Q2.

GDP-based recession indicator index. The plotted value for each date is based solely on information as it would have been publicly available and reported as of one quarter after the indicated date, with 2015:Q2 the last date shown on the graph. Shaded regions represent the NBER’s dates for recessions, which dates were not used in any way in constructing the index, and which were sometimes not reported until two years after the date.


Leave A Comment