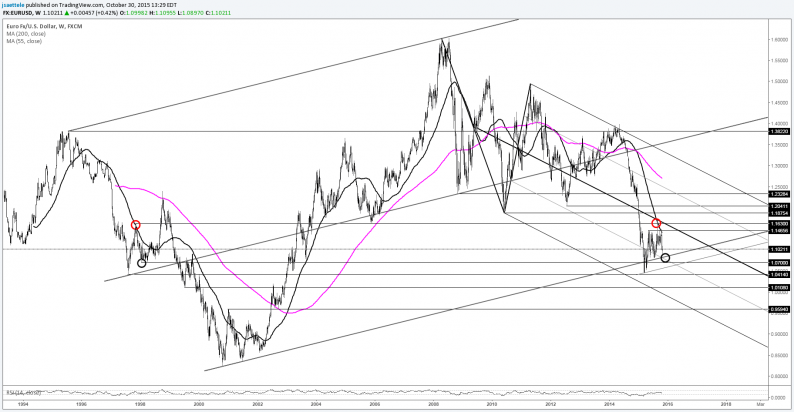
EUR/USD
Weekly
Click on image to enlarge
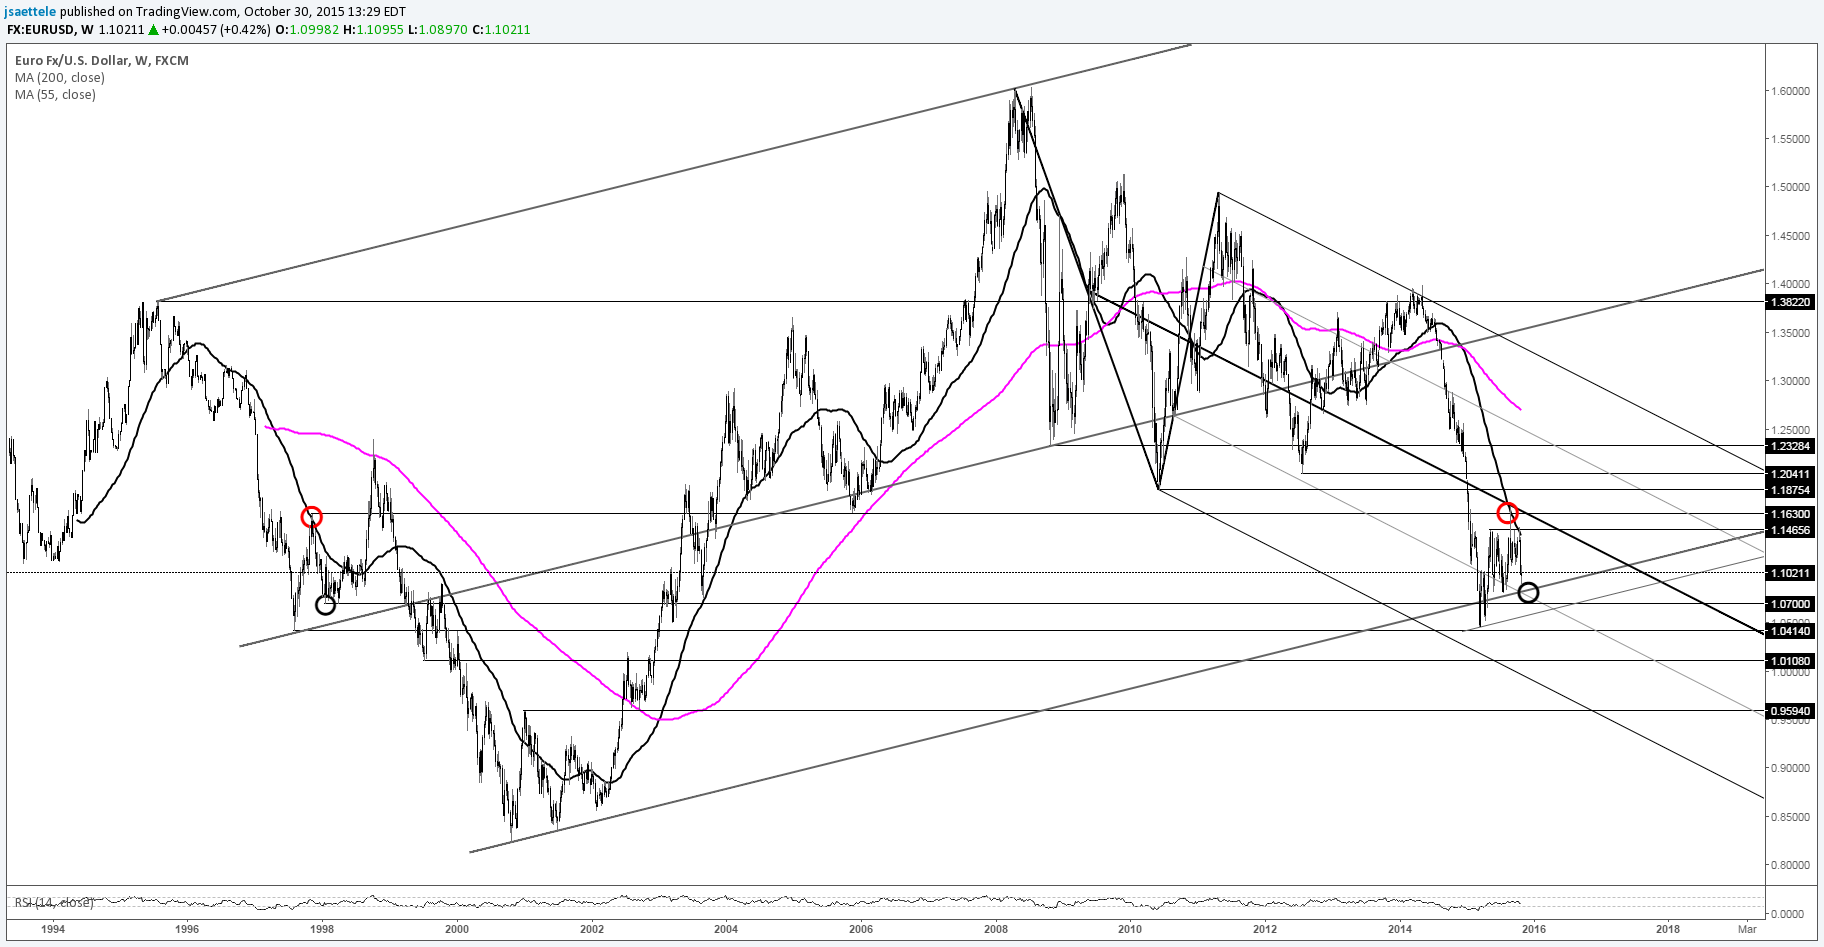
Chart Prepared by Jamie Saettele, CMT
For months, FX Technical weekly has been steadfast in that “support is estimated in the mid-1.0800s. Resistance is estimated in the mid-1.1400s (May and June high are 1.1435/65). A break on either side would indicate potential for a larger move.” EUR/USD traded 1.1494 (a bit above the cited level) 2 weeks ago and down to 1.0897 this week. This is support near term. Failure to hold here would make a breakdown a reality. It’s decision time.
GBP/USD
Weekly
Click on image to enlarge
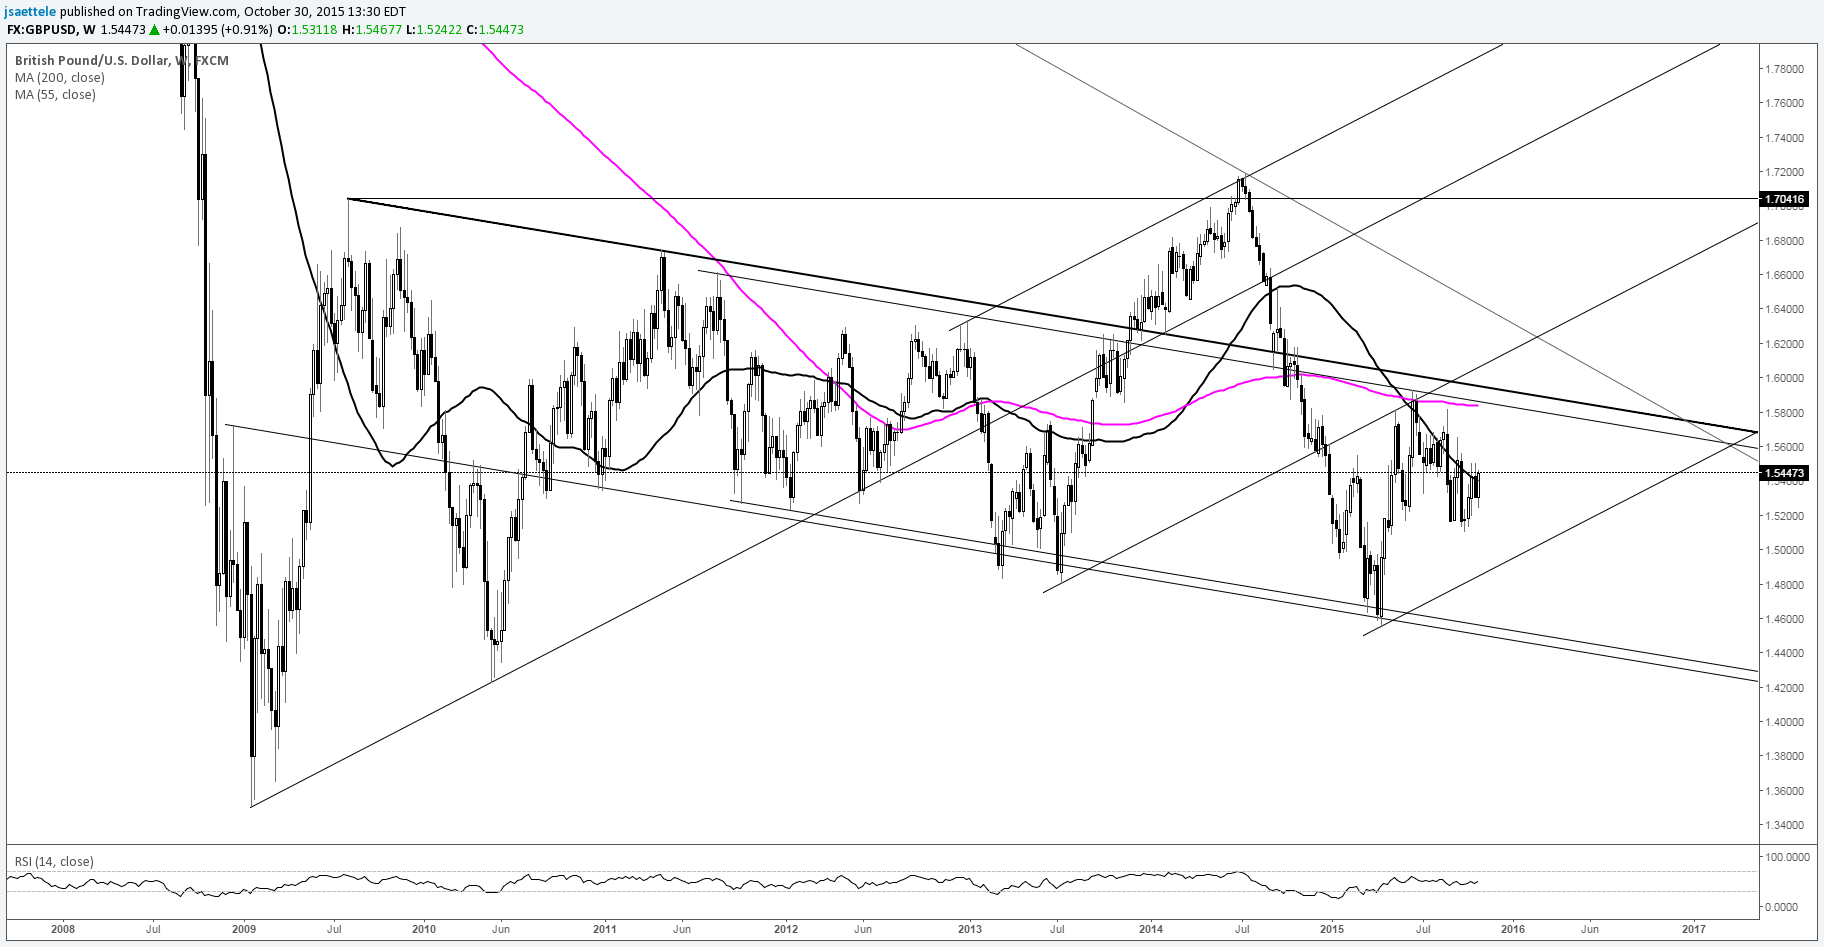
Chart Prepared by Jamie Saettele, CMT
The long term tradable slope in GBP/USD is best described by the line that extends off of the 2009 and 2011 highs and its associated parallels. Right now (10/30) is trading ‘no man’s land’ (not at support and we’re not at resistance) but resistance is 1.5800-1.6000…if it gets there.
AUD/USD
Weekly
Click on image to enlarge
Chart Prepared by Jamie Saettele, CMT
The AUD/USD rally failed 3 weeks ago (we were looking towards .7530-.7625) but bears aren’t in the clear here either. This week’s low registered at a long term median line (albeit downward sloping). Countertrend advances have materialized off of this line time and time again so respect potential for something other than another breakdown.
NZD/USD
Weekly
Click on image to enlarge

Chart Prepared by Jamie Saettele, CMT
NZD/USD continues to act well. After breaking through the August high 2 weeks ago, the rate has put in 2 weeks of consolidation and maintained the breakout level. FXTW maintains that “there probably isn’t solid resistance until near .70. .70 represents channel resistance and the 200 day average.”
USD/JPY
Weekly
Click on image to enlarge


Leave A Comment