The Chicago Fed’s National Activity Index, which we reported on this morning, is based on 85 economic indicators drawn from four broad categories of data:
The complete list is available here in PDF format.
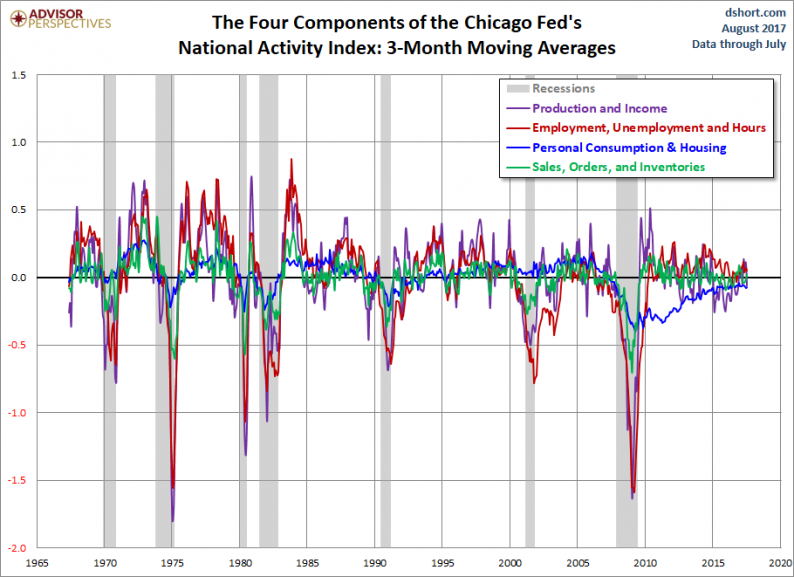
In this morning’s Chicago Fed update, we learned that “The Chicago Fed National Activity Index (CFNAI) moved down to –0.01 in July from +0.16 in June. Three of the four broad categories of indicators that make up the index decreased from June, and three of the four categories made negative contributions to the index in July. The index’s three-month moving average, CFNAI-MA3, moved down to –0.05 in July from +0.09 in June.”
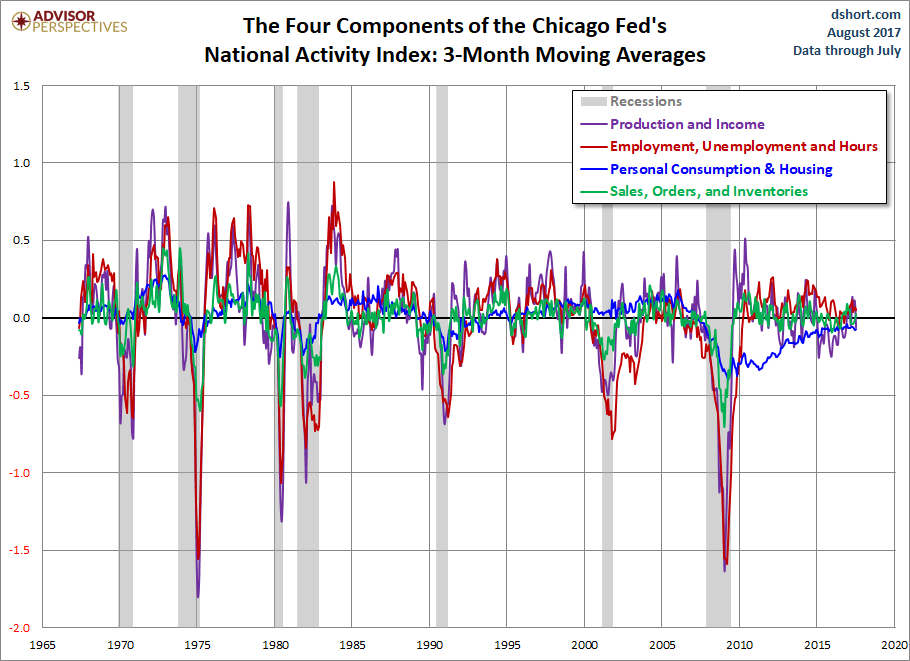
A chart overlay of the complete multi-decade span of all four categories, even if we use the three-month moving averages, is quite challenging for visual clarity:
So here is a close-up view since 2000:
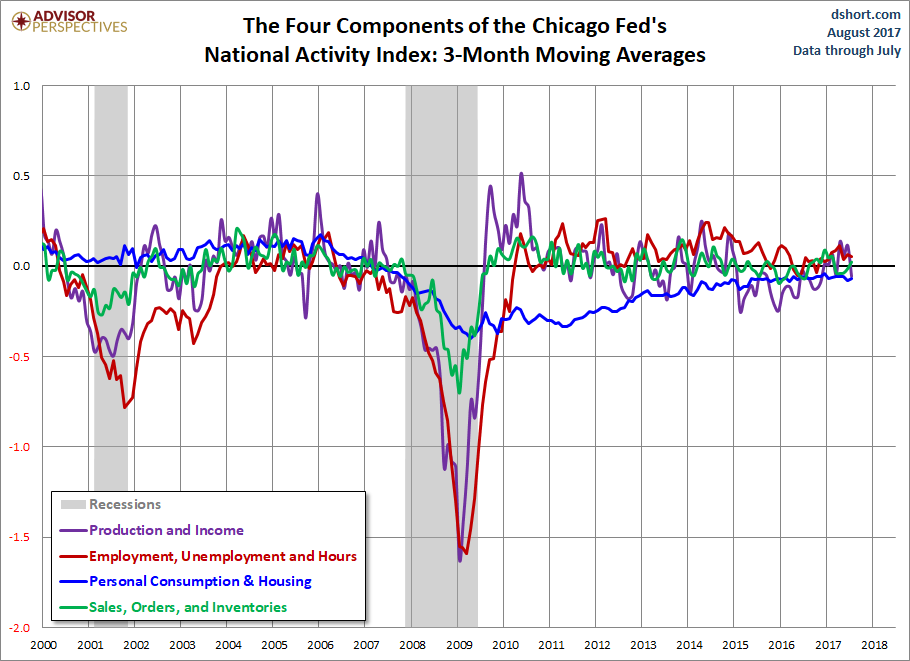
But a snapshot of the 21st century contains only two recessions, so it’s unclear how the individual components have behaved during the seven recessions since the 1967 starting point for this data series.
Here is a set of charts showing each of the four components since 1967. Because of the highly volatile nature of the data, the charts are based on three-month moving averages, a smoothing strategy favored by the Chicago Fed economists. The values for the months that the NBER subsequently identified as recession starts are also indicated.
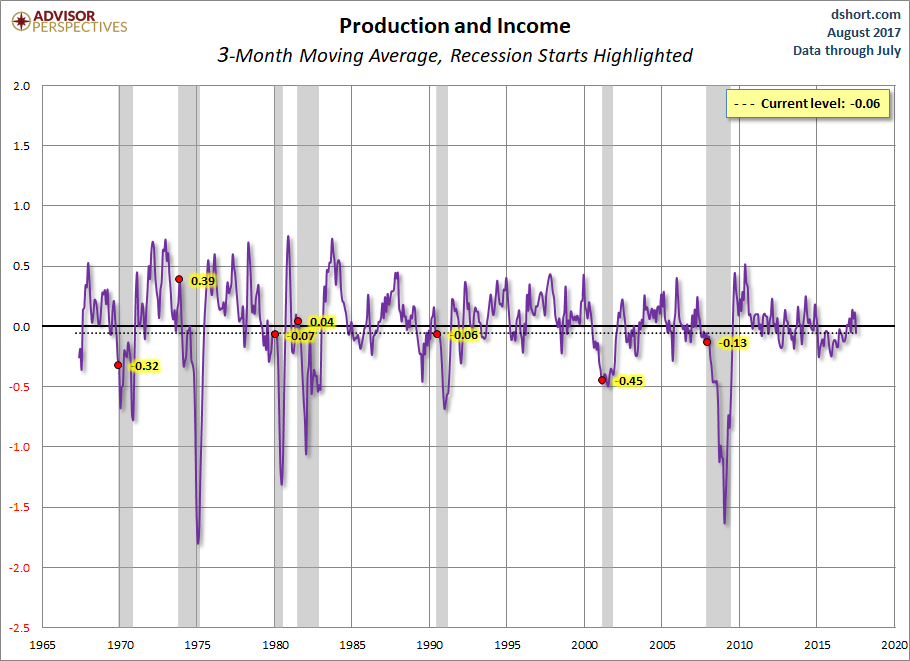

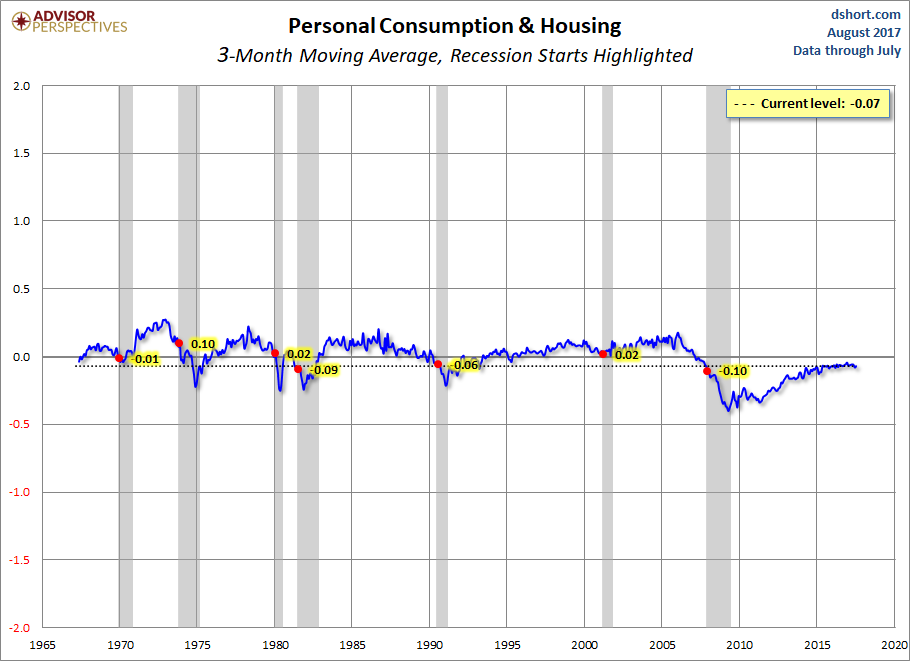
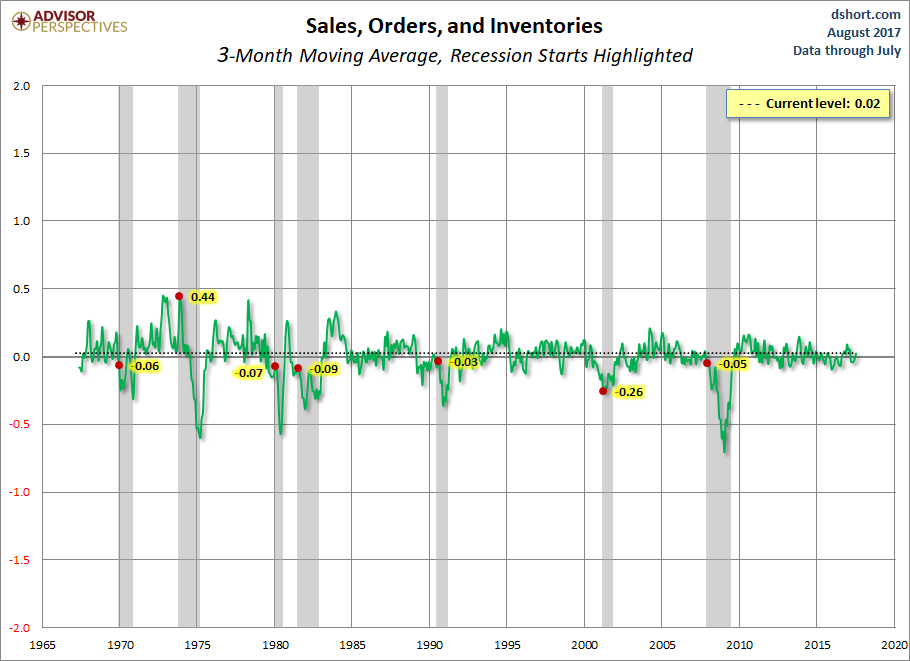
There’s a lot to digest in the individual charts. Clearly, the first two (“Production and Income” and “Employment, Unemployment and Hours”) are the more volatile of the quartet. It is also obvious that “Personal Consumption and Housing” has been the biggest drag since the onset of the Great Recession. Its current level is lower than at the onset of five of the seven recessions during the history of this data series.


Leave A Comment