
Now that the recently launched REX VolMAXX Long VIX Weekly Futures Strategy ETF (VMAX) and REX VolMAXX Inverse VIX Weekly Futures Strategy ETF (VMIN) VIX exchange-traded products have started to achieve critical mass, I thought it would be a good time to update my VIX ETP landscape chart.
In the graphic below, I have plotted all of the VIX ETPs with respect to their target maturity (X-axis) and leverage (Y-axis).
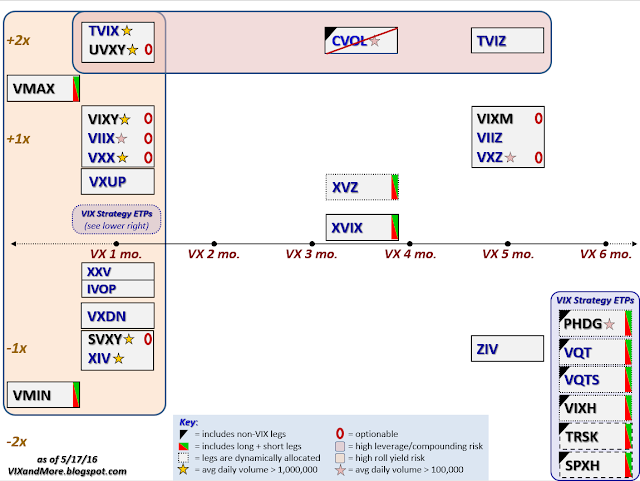
[source(s): VIX and More]
The most interesting change in this chart is the addition of VMAX and VMIN, which are on track to trade over 100,000 as a pair today for the first time since their launch two weeks ago. In deciding where to plot these two issues, I note that the 10-day historical volatility of VMAX and VMIN is approximately 30% higher than their more popular competitors, VXX and XIV. As VMAX and VMIN are actively managed and do not have a fixed target maturity, I am electing to assume that based on the early history, the target maturity is in the 2-3 week range. Additionally, while there is no leverage being used in the traditional sense, as is the case with UVXY, TVIX and TVIZ, so far the use of VIX weekly futures in addition to the standard monthly VIX futures means that VMAX and VMIN have a higher beta than VXX and XIV. For this reason, I have also plotted VMAX and VMIN as having slightly higher “leverage” than the group of VIX ETPs that have a target maturity of thirty days, such as VXX, XIV, etc.
Frankly, I am a little surprised that VMAX and VMIN have not attracted more interest in the trading community, as these products have features that should be very attractive to short-term traders. For now, the bid ask-spreads are typically in the 0.05 – 0.10 range, but as these tighten up, I expect volume and trading interest will ramp up quickly.
One necrology housekeeping note of interest: Citibank has decided to redeem early its C-Tracks Exchange-Traded Notes Based on the Citi Volatility Index Total Return (CVOL). The last day of trading for CVOL will be May 23, 2016, with cash payments to be made to investors on May 24, 2016. The diagonal “X” through the ticker symbol in the chart indicates that this is the last time CVOL will appear on this graphic.


Leave A Comment