
The U.S. stock market indexes lost 0.2-0.3% on Friday, slightly extending their short-term downtrend, as investors reacted to the monthly jobs data release. The S&P 500 index has reached the record high of 2,916.50 on August the 29th. It currently trades 1.5% below that high. Both, Dow Jones Industrial Average and the technology Nasdaq Composite lost 0.3% on Friday.
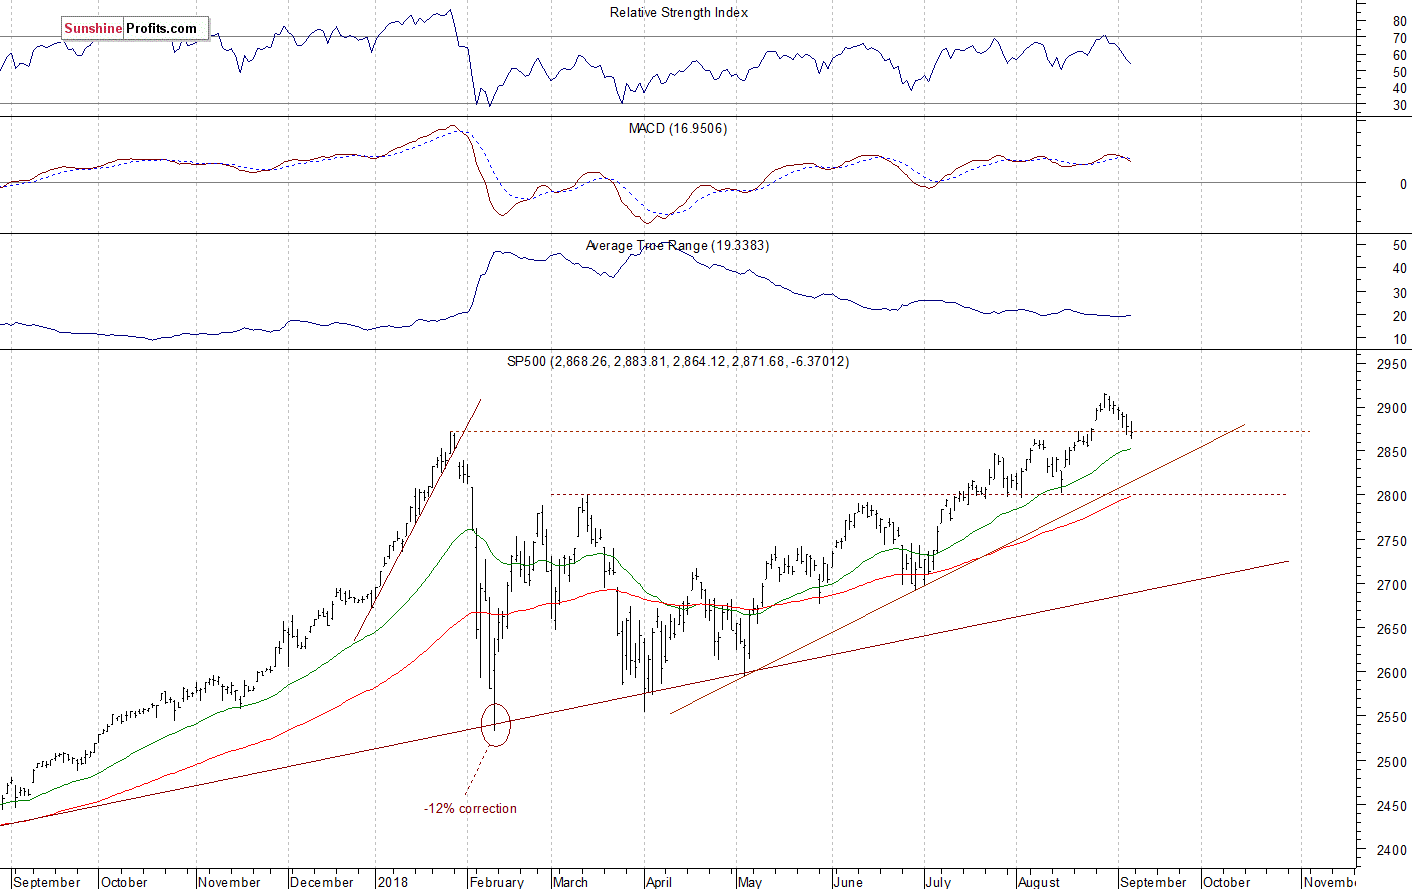
The nearest important level of support of the S&P 500 index is now at around 2,855-2,860, marked by the previous short-term local lows. The support level is also at 2,830-2,835. On the other hand, the nearest important level of resistance is at 2,885, marked by the previous support level. The next resistance level is at 2,900. The resistance level is also at 2,910-2,915, marked by the mentioned late August record high.
The broad stock market reached the new record high in the late August, as it extended its short-term uptrend above the level of 2,900. Since then it trades within a downward correction. The market retraced its late August advance, and it got back down to the support of its late January high. Will it continue lower or reverse higher towards the all-time high? For now, it looks like a downward correction within an uptrend. The index continues to trade above its medium-term upward trend line, as we can see on the daily chart:
Reversing Upwards?
The index futures contracts trade 0.4-0.6% above their Friday’s closing prices this morning. So, expectations before the opening of today’s trading session are positive. The European stock market indexes have gained 0.3-0.5% so far. There will be no new important economic data announcements today. The broad stock market will probably continue to fluctuate following the recent run-up. For now, it looks like a correction within an uptrend. There have been no confirmed negative signals so far.
The S&P 500 futures contract trades within an intraday uptrend, as it retraces some of its Friday’s decline. consolidation following its yesterday’s intraday decline. The nearest important level of resistance is now at around 2,890-2,895, marked by the local highs. The next resistance level is at 2,900. On the other hand, the support level is at 2,875, among others. The futures contract trades at its short-term downward trend line, as the 15-minute chart shows:


Leave A Comment