Gross Output Remains Under Pressure
We should mention right from the outset that recent data releases – weak as most of them were – are still not confirming an imminent recession with certainty. The situation remains a bit fuzzy: we see a lot of weakness in important data, and considering the overall picture – which includes what is happening globally – we can infer that the likelihood of a significant economic downturn this year is extremely high, but it’s not inevitable. While it is still possible that a recession can be dodged this year, that seems a low probability outcome by now.

Photo credit: Darren Ketchum
Last week the government has updated the gross output (GO) per industry data, which means we now have the picture until the end of Q3 2015. In terms of GDP, Q3 wasn’t much to write home about either (2% real), and we can see from GO that there has been weakness in quite a few business areas. The parts of the economy that are responsible for the bulk of wealth creation didn’t really do all too well. Our suspicion that the trends observed in the Q2 gross output data would continue has been confirmed – and in all likelihood, Q4 will once again show weakness. Below we compare the y/y change rates of selected gross output data to those of new orders for capital goods and industrial production.
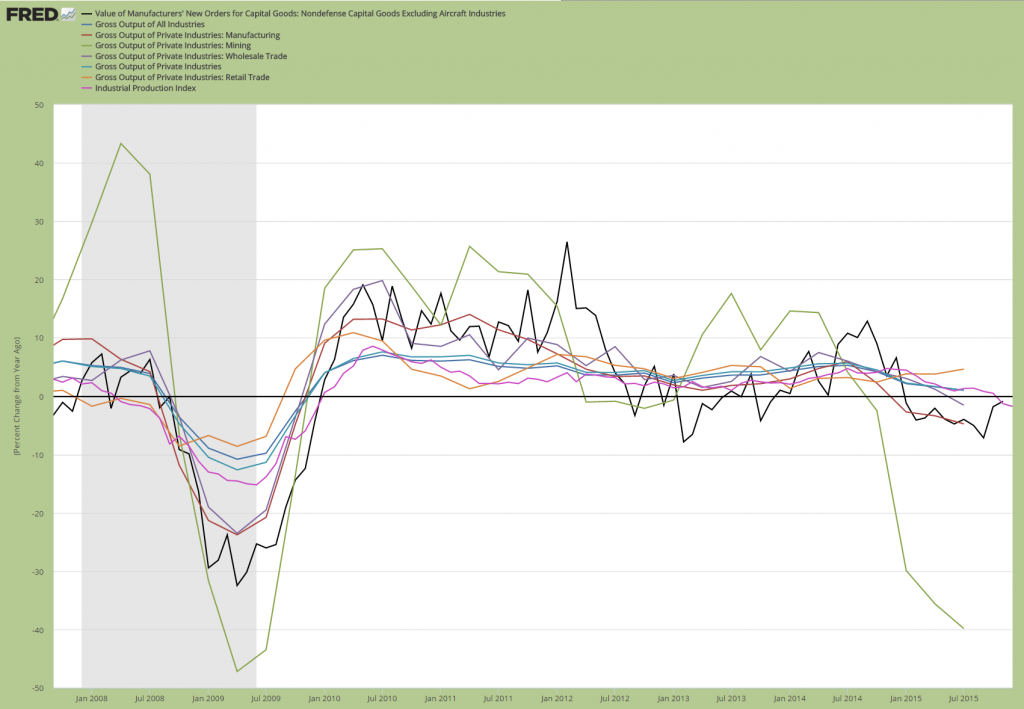
The lines ending in Q3 show the gross output data of: all private industries, mining, manufacturing, wholesale trade, retail trade. As you can see, only retail sales managed to show positive growth momentum among these – growth in every other sector (including the combined data) has weakened further, with manufacturing, mining and wholesale trade all in negative territory (note that utilities and construction output, which are not shown above, both grew). The black line depicts the growth rate of new orders for non-defense capital goods, the purple line (which is the most up-to-date series at the moment) shows the y/y rate of change in industrial production – which has likewise turned negative – click to enlarge.
The data shown above are definitely consistent with what is normally seen at the onset of recessions. However, there are historical examples of “false positives”, one of which we will discuss further below, as it seems relevant to the current situation. First a few more words on gross output though. As he always does when the data are updated, Mark Skousen has discussed them as well and has published an update of the adjusted GO/GDP growth comparison chart:


Leave A Comment