
A Warning Signal from Market Internals
Readers may recall that we looked at various market internals after the sudden sell-offs in August 2015 and January 2016 in order to find out if any of them had provided clear advance warning. One that did so was the SPX new highs/new lows percent index (HLP). Below is the latest update of this indicator.
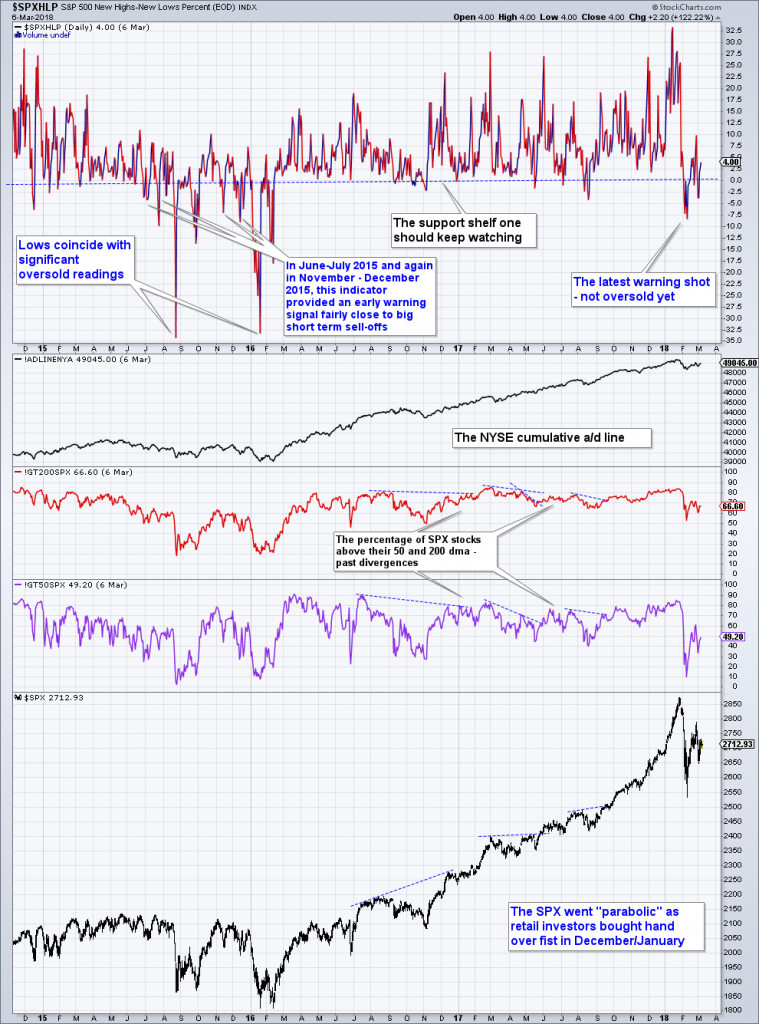
HLP (uppermost panel) provided advance warning prior to the sell-offs of August 2015 and January 2016 by dipping noticeably below the zero line shortly before the selling started. They briefly returned to positive territory after the first dip, and after a third or fourth dip in close succession the sell-off commenced. What is currently of interest to us is that the sell-offs themselves generated deeply oversold readings in HLP in excess of -30. Only then did the market bottom and reverse back up. This is interesting because the early February sell-off has only managed to generate a warning signal so far. We have seen two dips below the zero boundary since then, but an oversold reading has not been generated yet. Based on this indicator, we are now merely in the phase prior to the actual sell-off. Looking at the third and fourth panels from the top, note that while the percentage of stocks below the 50-dma (purple line) did reach comparable “oversold levels” in February, the percentage of stocks below the 200 dma (red line) did not. Currently both percentages are almost at the same level they inhabited just before the August 2015 sell-off.
A Mitigating Factor
Short-term traders should keep an eye on the Russell 2000 Index. In recent trading days, relative strength in this index (which contrasts with its persistent relative weakness prior to the February sell-off) invariably presaged intraday rebounds in the other major indexes after they initially sold off on negative news-flow (mainly in connection with the president becoming more active with his protectionist agenda).


Leave A Comment