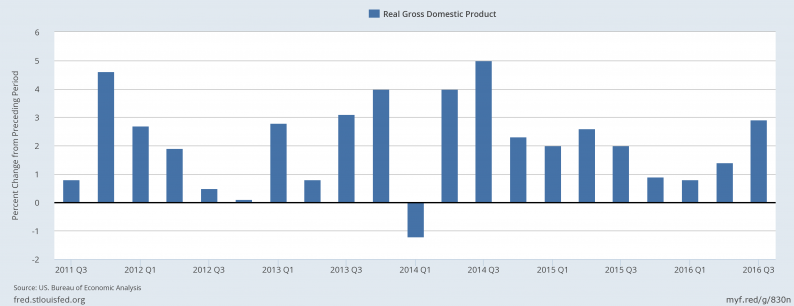
On Friday, the BEA released the first estimate of 3QA GDP.The headline rate was 2.9% — a welcome change from the previous 3 quarters. However, this marked the 8th consecutive quarter below 3%:

PCEs continued their strength:
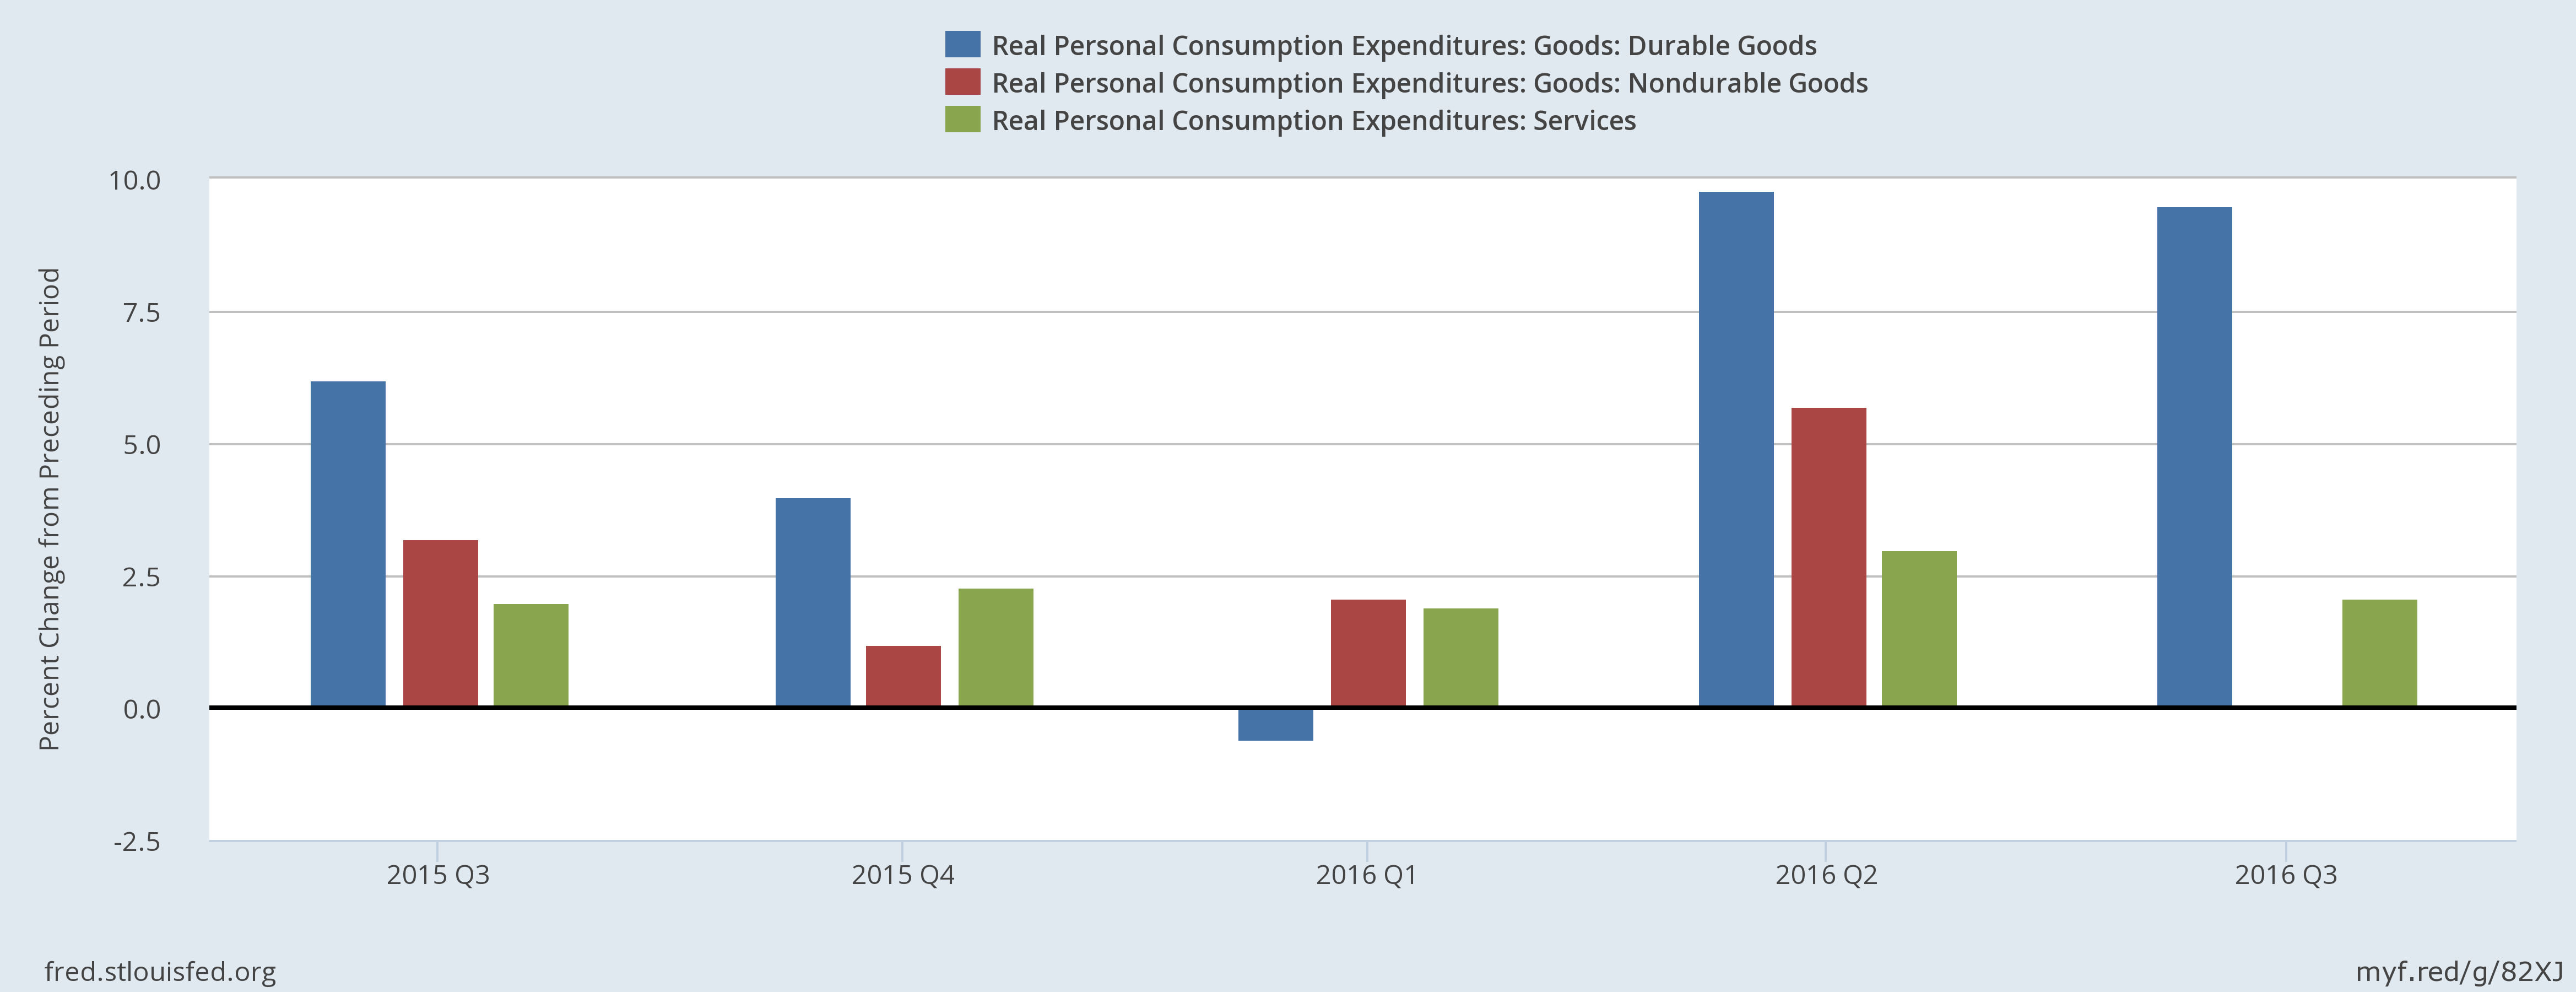
Durable goods purchases (blue) increased strongly for the second consecutive quarter. Service expenditures (green) maintained their recent pace. But nondurable goods (red) spending was weak. Investment spending was mixed:
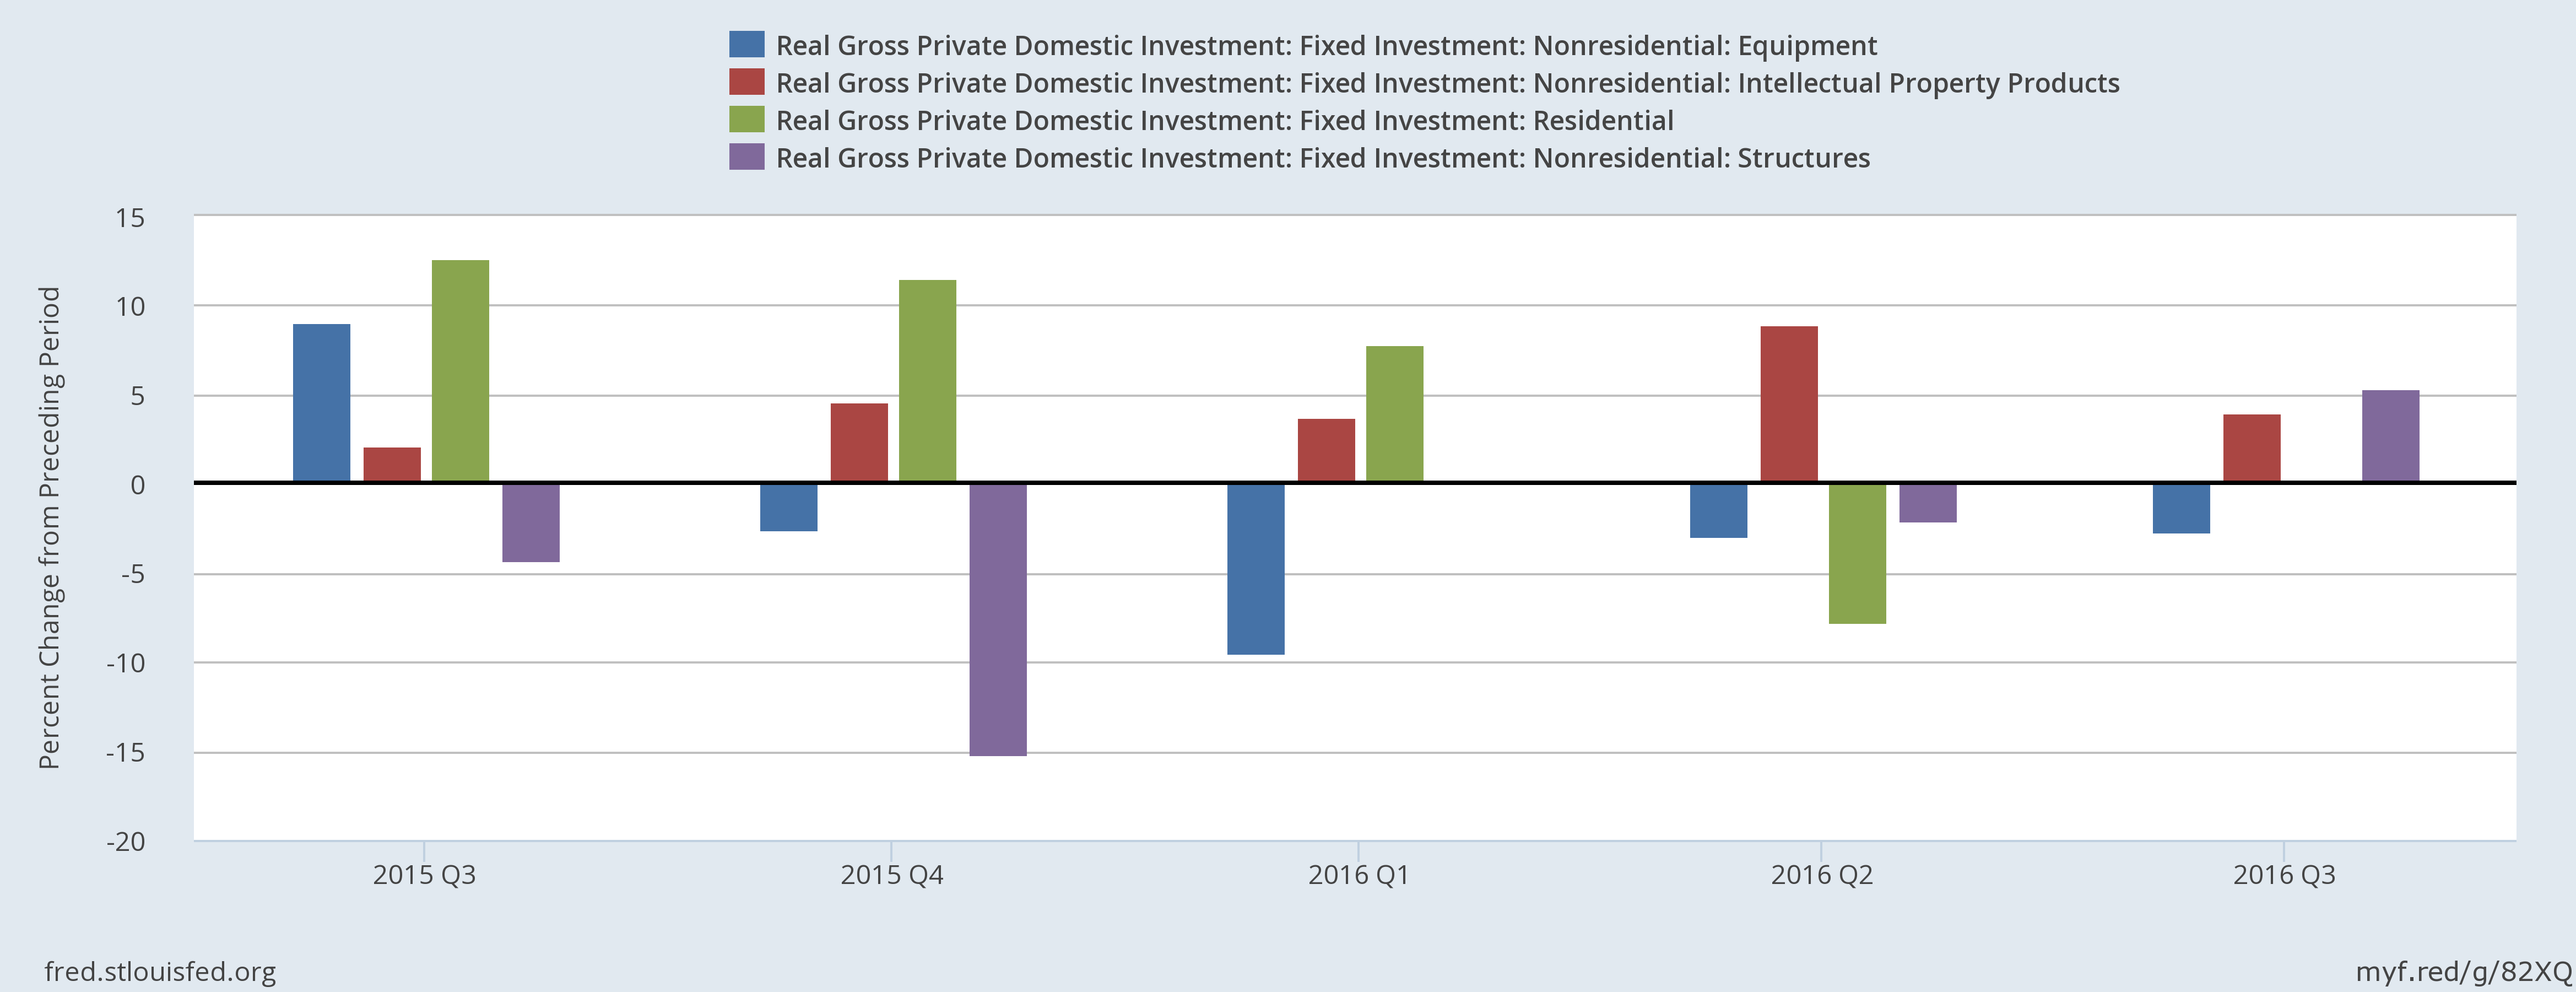
Equipment spending contracted for the 4th consecutive quarter. But nonresidential structures (purple) increased for the first time in 5 quarters. Residential spending (green) was flat. Several areas supported growth:
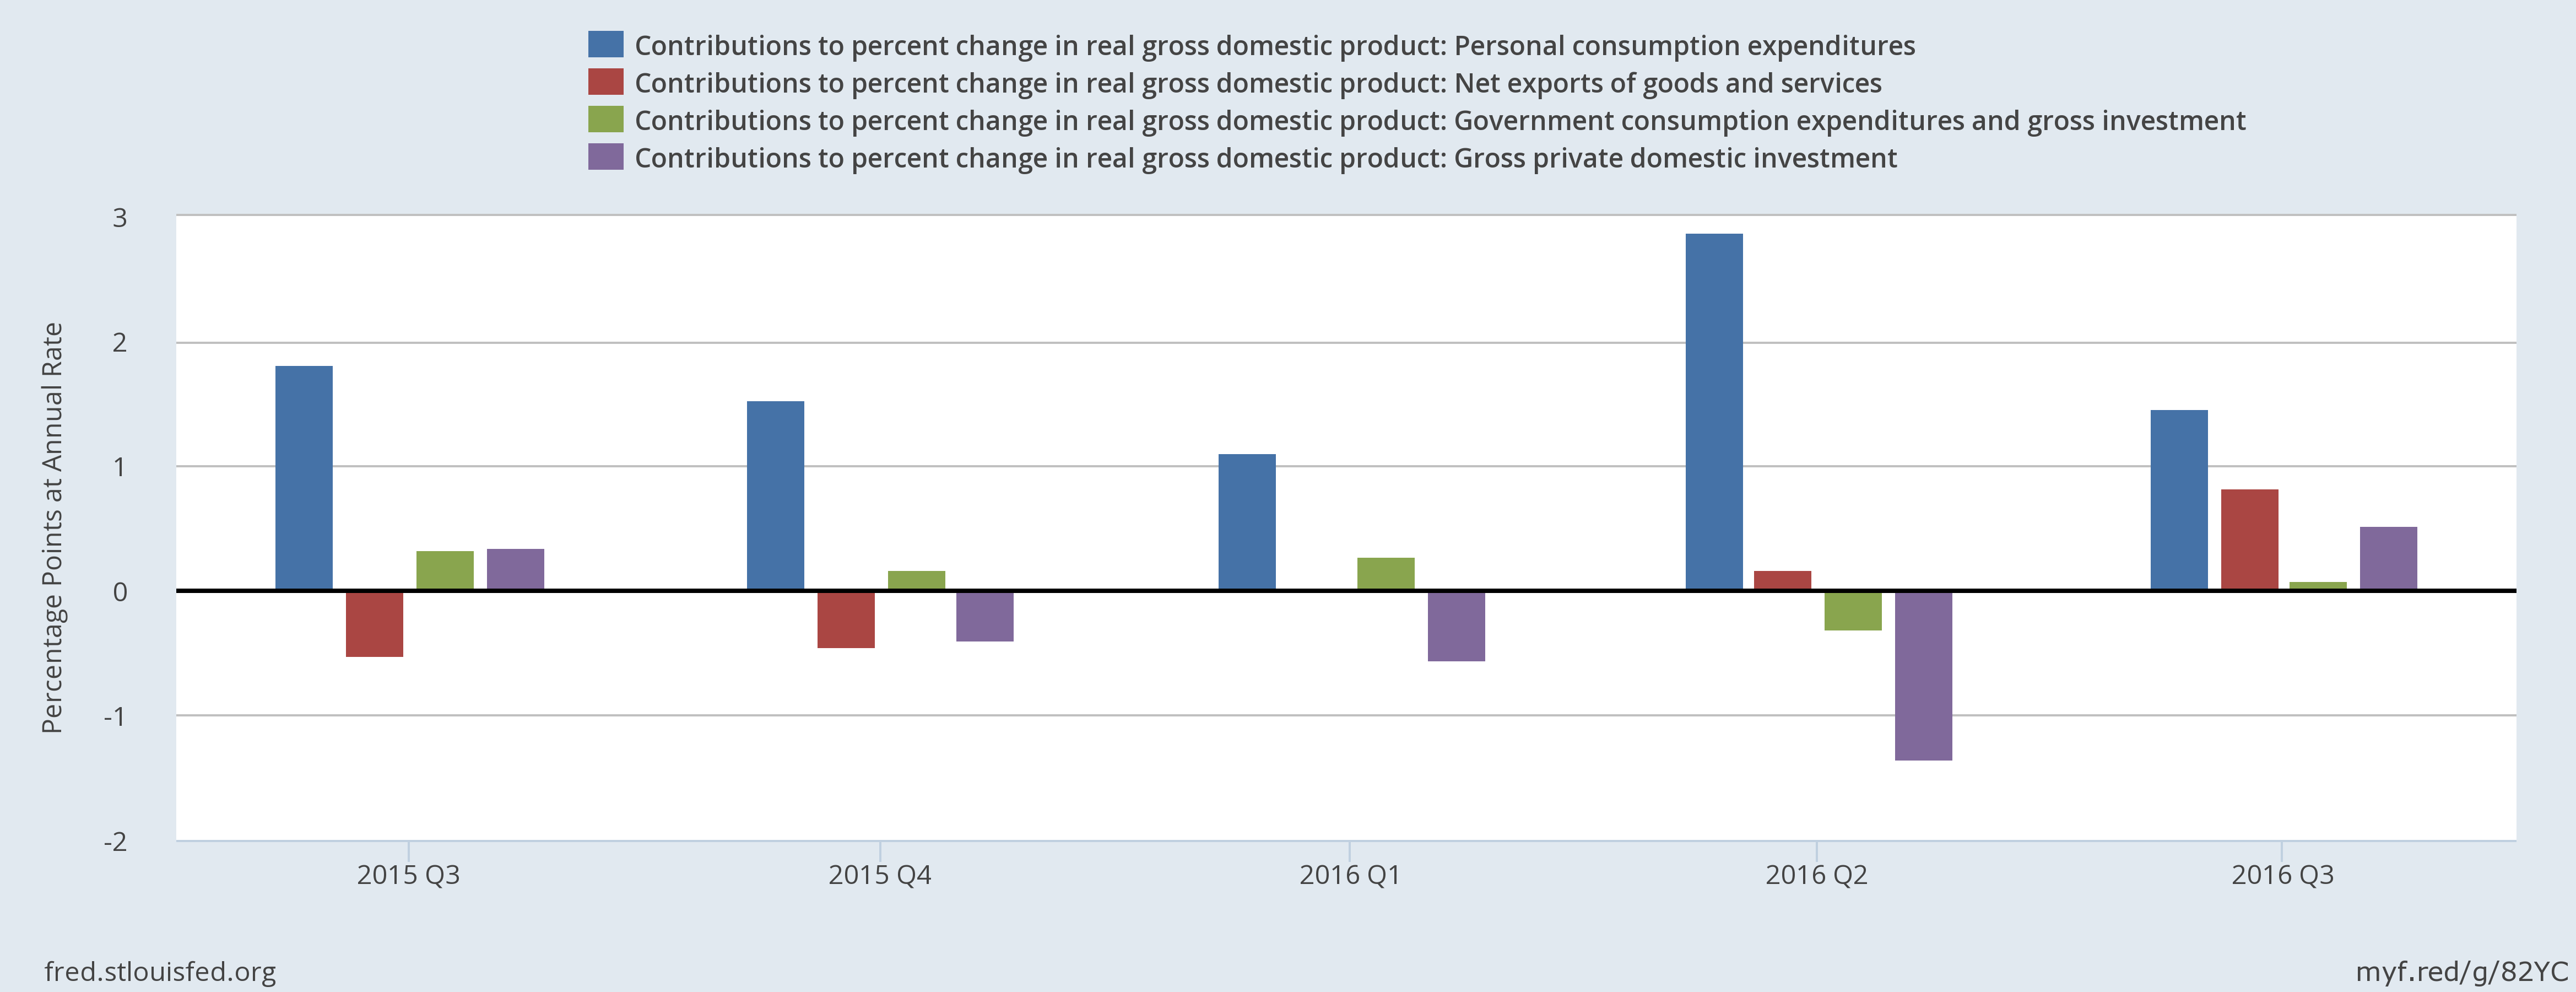
In the previous 4 quarters, household spending (blue) was the primary growth driver. But last quarter, exports (red) and investment (purple) also contributed.
In other news, building permits increased, due to a slight increase in 1-unit structures and a large increase in multi-family applications. Durable goods orders continued their 1+ year sideways movement. But even so, the non-defense, ex-aircraft number continues its slight downward trend. This isn’t fatal, but it does indicate a weakness in business investment. And the Case Shiller index rose, indicating there is adequate housing demand to pull prices higher.
Economic conclusion: the GDP number is the clearly this week’s stand-out economic report. The 3rd quarters 2.9% increase was a welcome change from the previous three quarters’ sub 1% readings. Other news was also positive.Building permits, which posted a strong increase, are a long-leading indicator; this bodes well for future growth. The Case Shiller’s increase shows there is still plenty of demand for housing, which is supported by a strong jobs market, growing earnings and low interest rates. Overall, this week’s news was very supportive.
Market Condition: The markets sold off last week; the SPYs dropped .67% while the QQQs were .89% lower.But the IJHs (mid-caps) moved down 1.75% while the IWMs fell 3.17%, indicating a clear risk off bias in the market. And the IWMs daily chart, which is a good proxy for the market’s overall risk appetite, points to continued weakness:


Leave A Comment