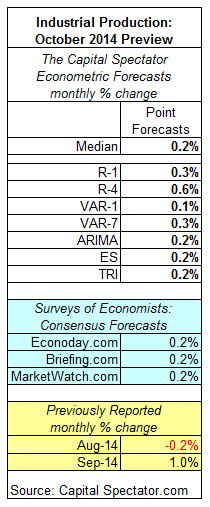
US industrial production in October is projected to increase 0.2% vs. the previous month in tomorrow’s report from the Federal Reserve, according to the Capital Spectator’s median point forecast for several econometric estimates. The expected gain represents a substantial deceleration in growth relative to September’s 1.0% advance.
Compared with a trio of estimates based on recent surveys of economists, the Capital Spectator’s median projection for October matches the consensus forecasts.
Here’s a closer look at the numbers, followed by brief definitions of the methodologies behind the Capital Spectator’s forecasts that are used to calculate the median projection:

R-1: A linear regression model using the ISM Manufacturing Index to predict industrial production. The historical relationship between the variables is applied to the more recently updated ISM data to project industrial production. The computations are run in R.
R-4: A linear regression model using four variables to project industrial production: US private payrolls, an index of weekly hours worked for production/non supervisory employees in private industries, the ISM Manufacturing Index, and the stock market (Wilshire 5000). The historical relationships between the variables are applied to the more recently updated data to project industrial production. The computations are run in R.
VAR-1: A vector auto regression model using the ISM Manufacturing Index to predict industrial production. VAR analyzes the interdependent relationships of the variables through history. The forecasts are run in R using the “vars” package.
VAR-7: A vector auto regression model using seven variables to project industrial production: US private payrolls, an index of weekly hours worked for production/non supervisory employees in private industries, the ISM Manufacturing Index, the stock market (Wilshire 5000), real personal income less current transfer receipts, real personal consumption expenditures, and oil prices. VAR analyzes the interdependent relationships through history. The forecasts are run in R using the “vars” package.


Leave A Comment