
The upcoming calendar provides a mixed brew of inflation data, Fed news, and continuing world crises. Adding the recent daily focus on energy prices and skepticism about stocks leads to the likely media focus for the week:
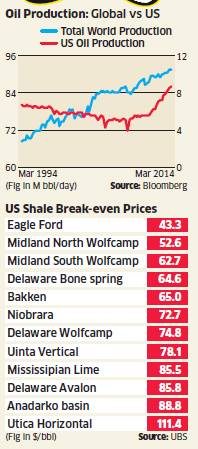
Is it time to buy commodities?
Prior Theme Recap
In my last WTWA I predicted that a light week for data would produce a parade of pundits, all wondering whether it was too late to join the stock market rally. That was an accurate guess. Whether you were watching on financial TV or reading your favorite sources, there was an extra helping of commentary. It covered the full range from crashes and recessions to year-end rallies.
Feel free to join in my exercise in thinking about the upcoming theme. We would all like to know the direction of the market in advance. Good luck with that! Second best is planning what to look for and how to react. That is the purpose of considering possible themes for the week ahead.
This Week’s Theme
We can expect a normal flow of economic data this week featuring key reports on housing, the FOMC minutes, and the monthly inflation reports. The backdrop for this news includes four additional factors:
From this combination, I expect many to ask whether it is (finally) time to buy commodities. Here are some key viewpoints:
Before turning to my own conclusions, let us do our regular update of the last week’s news and data. Readers, especially those new to this series, will benefit from reading the background information.
Last Week’s Data
Each week I break down events into good, and bad. Often there is “ugly” and on rare occasion something really good. My working definition of “good” has two components:
The Good
The news last week was mostly good, even better than stock prices suggested.
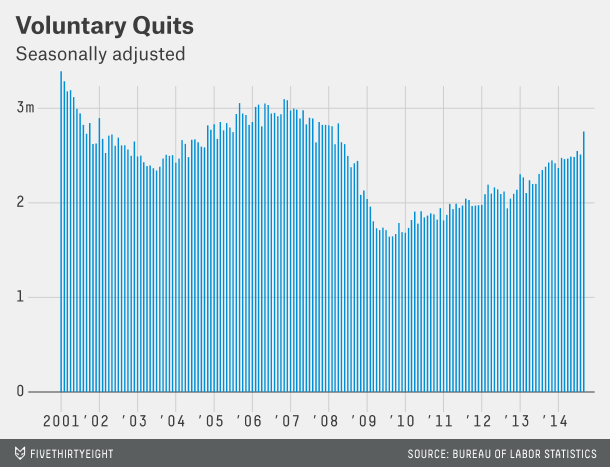
The employment quit rate has increased dramatically. For years I have encouraged readers to ignore those who tried to use the JOLT’s report (labor turnover) as a back-door method for estimating job growth. It is inferior for that purpose, but better at analyzing structural employment issues. If you want to look at overall economic health, the quit rate is a solid indicator. Fivethirtyeight (see strong and similar analysis and chart from Business Insider) has strong analysis and a helpful chart:
The rising number of quits is good news for several reasons. It’s a sign of confidence. Quitting your job almost always entails some risk, even if you have a new one lined up, so workers’ increasing willingness to do so suggests they think the job market is getting better. Changing jobs is also an important source of wage growth, particularly for younger workers. And job turnover of all kinds acts as a kind of lubricant in the job market, as employees who leave jobs create opportunities for others.


Leave A Comment