USD/CAD reversed directions last week and posted a sharp gain of 170 points. The pair closed the week at 1.3481. This week’s key events are retail sales reports and GDP. Here is an outlook on the major market- movers and an updated technical analysis for USD/CAD.
Last week’s US data was soft. Construction numbers were mixed and manufacturing and employment numbers missed their estimates. In Canada, CPI was unchanged, posting a weak gain of 0.2%.
Updates:
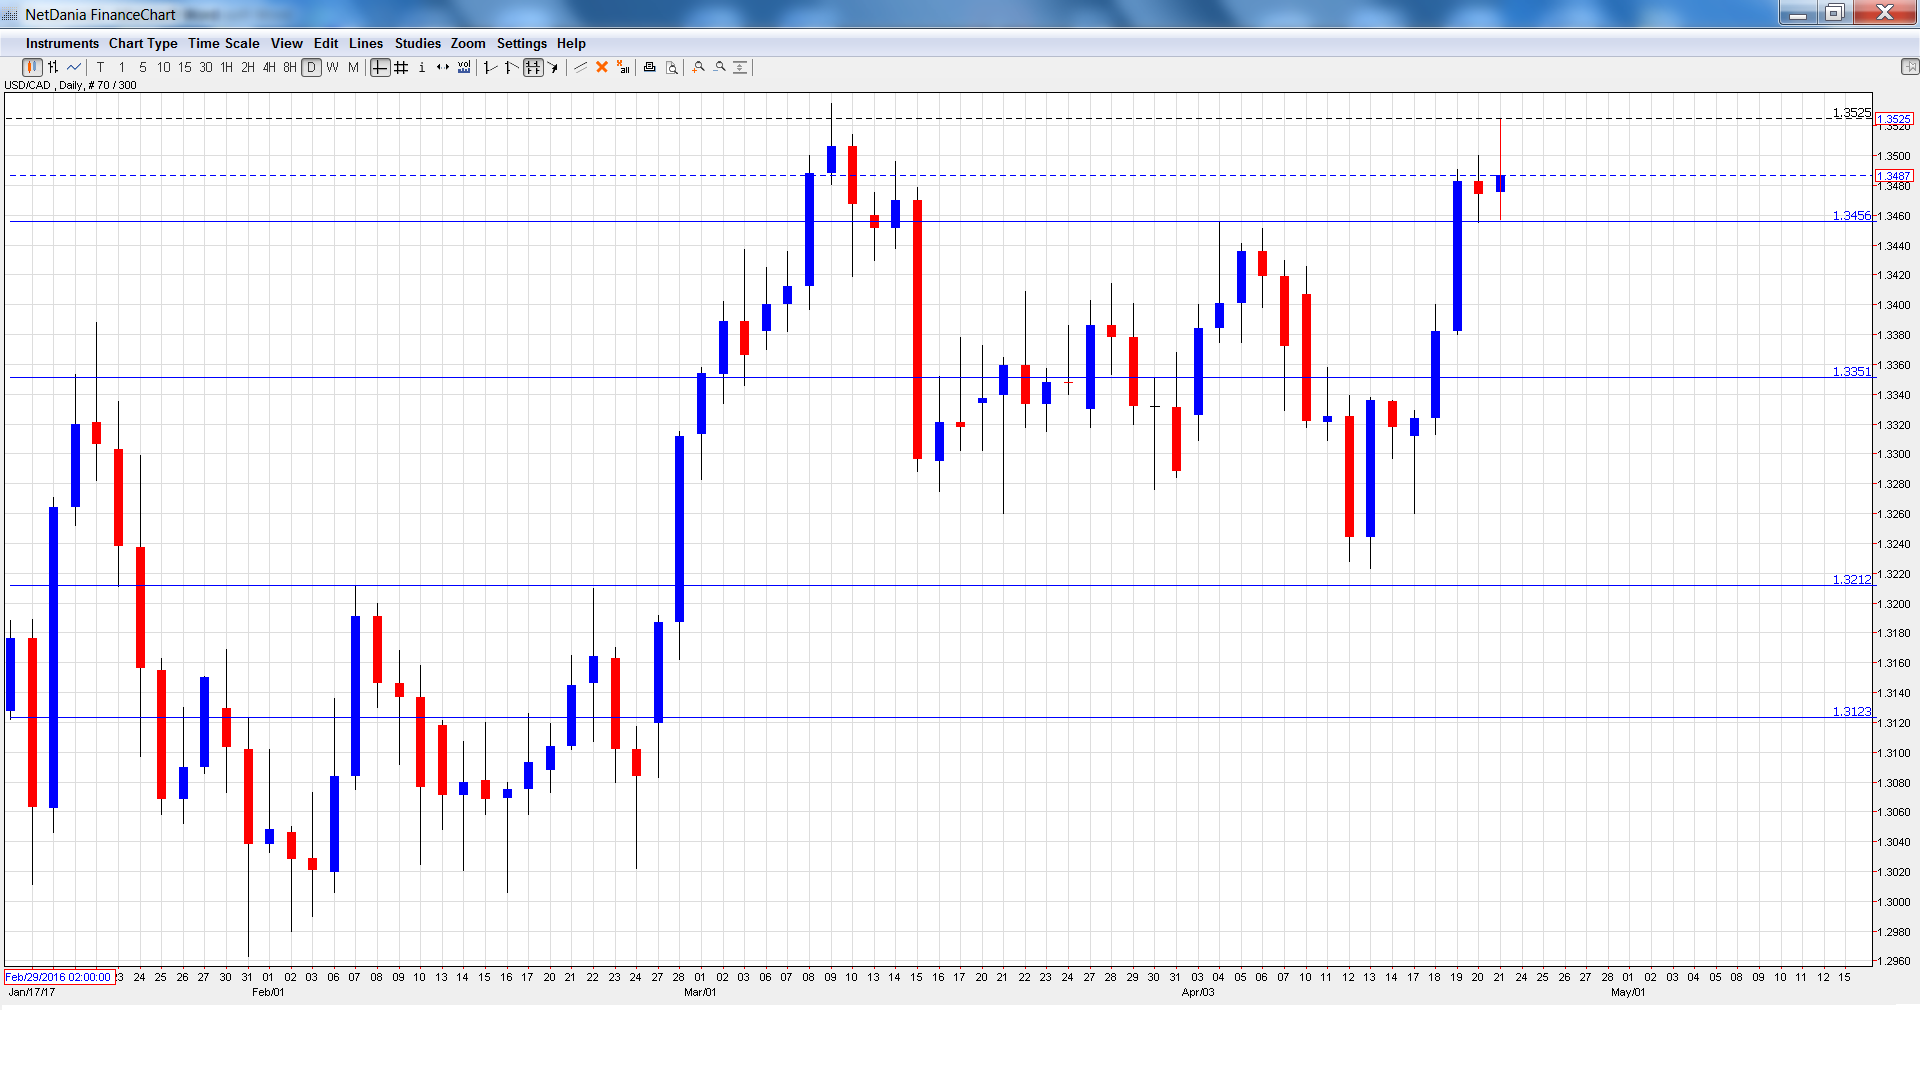
USD/CAD daily graph with support and resistance lines on it. Click to enlarge:
Wholesale Sales: Monday, 12:30. Wholesale Sales soared 3.3% in February, crushing the estimate of 0.3%. Another strong gain is expected in March, with an estimate of 2.1%.
Core Retail Sales: Wednesday, 12:30. This is the first key event of the week. The indicator climbed 1.7% in February, above the forecast of 1.3%. This was the strongest gain in over two years. Will the indicator repeat with another strong performance in March?
Retail Sales: Wednesday, 12:30. Retail Sales is the primary gauge of consumer spending. The indicator bounced back in February with a strong gain of 2.2%, above the estimate of 1.5%.
GDP: Friday, 12:30. GDP, which is released monthly, is one of the most important economic indicators and should be treated as a market-mover. In January, the economy expanded 0.6%, above the forecast of 0.3%. This marked its best showing since June 2016.
RMPI: Friday, 12:30. This manufacturing inflation index continues to soften, and dropped to 1.2% in February. Still, this beat the estimate of 0.8%. Will we see a stronger reading in March?
USD/CAD Technical Analysis
USD/CAD opened the week at 1.3312 and quickly dropped to a low of 1.3260. Late in the week, the pair climbed to a high of 1.3525, as resistance held firm at 1.3551 (discussed last week). USD/CAD closed the week at 1.3481.
Technical lines, from top to bottom


Leave A Comment