The Canadian dollar sparkled last week, as USD/CAD plunged 300 points. The pair closed at 1.2946, its lowest weekly close since August 2016. This week’s key event is Employment Change. Here is an outlook on the major market-movers and an updated technical analysis for USD/CAD.
Canadian GDP softened to 0.2%, but still matched the estimate. In the US, Final GDP in Q1 was revised upwards to 1.4%, above the estimate of 1.2%. Janet Yellen did not say anything regarding monetary policy, but her colleagues seem more skeptical about inflation picking up.
Updates:
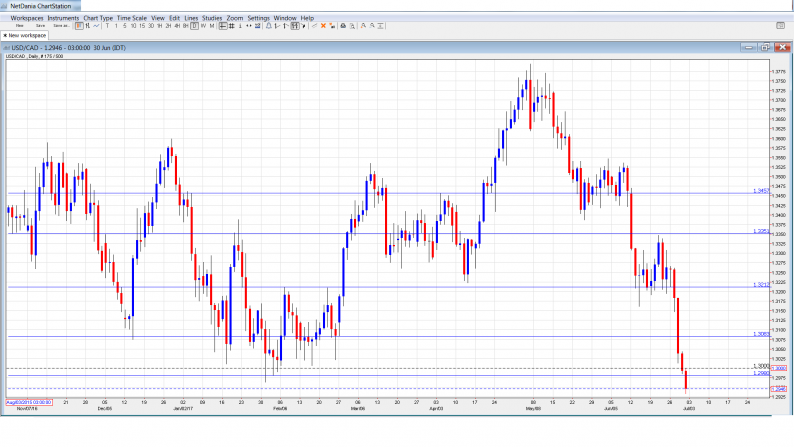
USD/CAD daily graph with support and resistance lines on it. Click to enlarge:

Manufacturing PMI: Tuesday, 9:30. The indicator continues to point to expansion in the manufacturing sector, but dipped to 55.1 in May. Will the index rebound in the June report?
Trade Balance: Thursday, 8:30. Canada posted a third straight trade deficit in April, coming in at C$-0.4 billion. This was weaker than the estimate of C$0.0 billion.
Building Permits: Thursday, 8:30. Building Permits tends to show sharp fluctuations, making accurate forecasts a tricky task. In April, the indicator declined 0.2%, well off the forecast of +2.4%.
Employment Change: Friday, 8:30. This is the key event of the month. In May, the indicator sparkled with a gain of 54.5 thousand, crushing the forecast of 11.5 thousand. Will we see another strong gain in June? The unemployment rate remained at 6.6% in May, matching the forecast.
Ivey PMI: Friday, 10:00. Ivey PMI softened to 53.8 in May, missing the estimate of 62.0. This marked its weakest reading since August 2016. Will we see a rebound in the June report?
USD/CAD Technical Analysis
USD/CAD opened the week at 1.3259 and quickly climbed to a high of 1.3266. It was all downhill from there, as the pair dropped to a low of 1.2933, breaking below support at 1.2980 (discussed last week). The pair closed the week at 1.2946.
Technical lines, from top to bottom


Leave A Comment