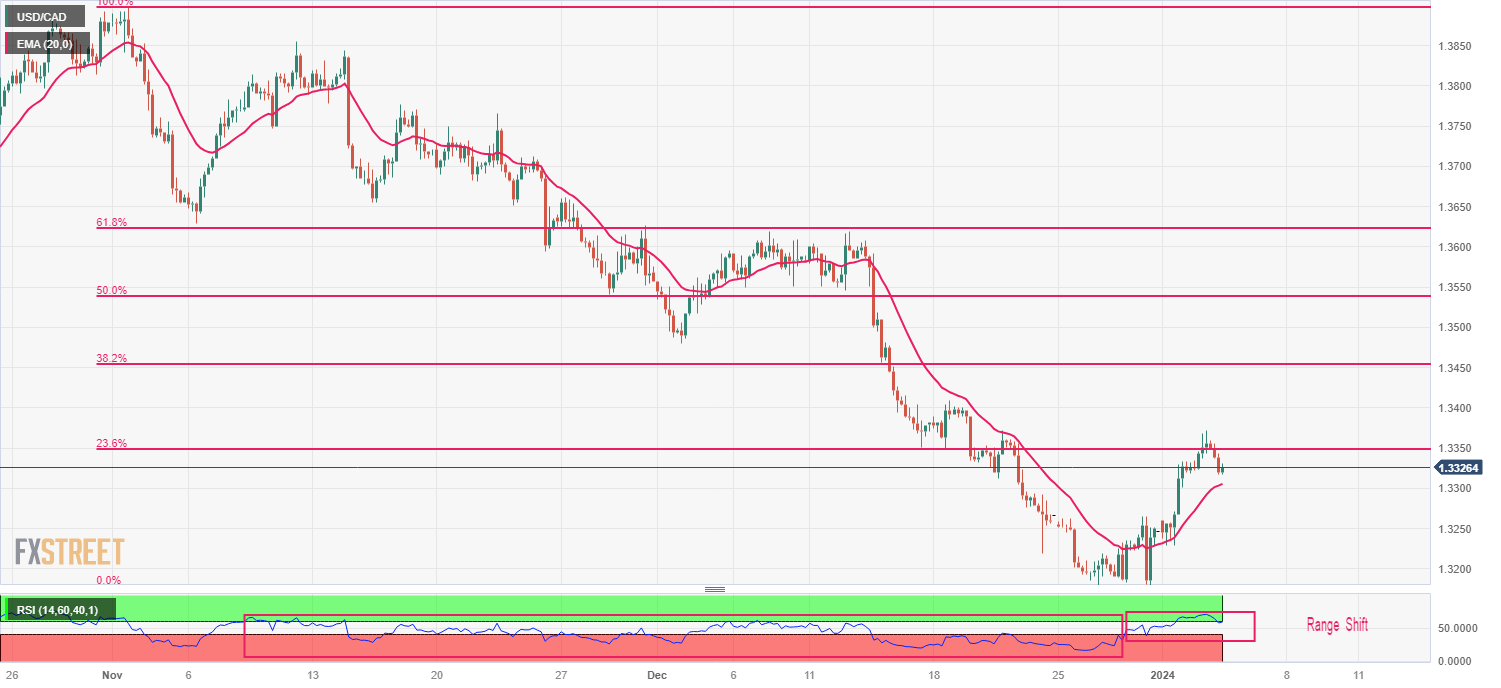
The USD/CAD pair falls sharply after failing to extend upside above 1.3370. The Loonie asset has dropped to near 1.3320 as the US Dollar Index (DXY) has corrected after the release of the Federal Open Market Committee (FOMC) minutes strengthened prospects of rate cuts this 2023. The timing factor is still uncertain as Fed policymakers are needed to confirm progress in inflation declining towards 2% first.S&P500 futures have posted some gains in the European session, portraying a revival in the risk-appetite of the market participants. The USD Index has dropped to near 102.20 ahead of the release of the employment data for December.Investors also await the Employment data from Canada, which will be published on Friday. The Unemployment Rate is seen rising to 5.9% against the former reading of 5.8%. Labor additions made by Canadian employers were 13.5K, lower than prior additions of 24.9K made in November.USD/CAD struggles to climb above the 23.6% Fibonacci retracement (plotted from 1 November 2023 high at 1.3900 to 27 December 2023 low at 1.3177) at 1.3350. The asset may find an intermediate support near the 20-period Exponential Moving Average (EMA), which currently trades around 1.3306.A range shift move by the Relative Strength Index (RSI) (14) into the 40.00-80.00 trajectory from the 20.00-60.00 area indicates that the downside bias has been faded now and investors may look for dips to build fresh positions.Fresh upside would appear if the Loonie asset decisively breaks above 23.6% Fibo retracement, which is around 1.3350. This will drive the asset towards December 18 high at 1.3410, followed by 38.2% Fibo retracement at 1.3453.On the flip side, downside bias could stem if the pair drops below December 28 low of 1.3180. This would expose the asset to July 25 low near 1.3150, followed by July 13 low around 1.3193. USD/CAD four-hour chart  USD/CAD
More By This Author:GBP/JPY Price Analysis: Refreshes Weekly High Above 182.00 EUR/GBP Loses Ground Above 0.8600 Ahead Of German CPI Data USD/CAD Halts Its Winning Streak On Improved Oil Prices, Trades Near 1.3340


Leave A Comment