
EUR/USD
4 hour

The EUR/USD is showing strong bearish candles as it approaches a horizontal support level (blue). The alternative is a wave 3 if price manages to break below this support and the 161.8% Fibonacci target.
1 hour

The EUR/USD broke another bear flag (dotted green) and is building a continuation as part of a wave 5 (orange). The blue line is a strong bottom from the 4 hour chart which could act as a bouncing spot.
GBP/USD
4 hour

The GBP/USD has broken the resistance levels (dotted) and price moved up towards the 61.8% Fibonacci level. A break above the long-term resistance trend line (red) and the 100% Fibonacci level invalidates the current wave count where a bigger bearish ABC (pink) is expected.
1 hour

The GBP/USD built a bearish ABC zigzag (blue) yesterday. Price then broke above the resistance trend line (orange dotted) and showed bullish momentum. For the moment this has been marked as a wave A (grey). A break of the support trend line invalidates the ABC (grey) within waves Y (blue, green) of wave B (pink).
USD/JPY
4 hour

The USD/JPY broke above both resistance trend lines (dotted) and is heading towards the 200% Fibonacci level and potentially higher. This makes it more likely that a wave 3 (purple) is developing rather than a wave C (pink), because wave C’s tend to equal 100% of wave A with 61.8% on the lower end of the range and 161.8% on the higher end.
1 hour
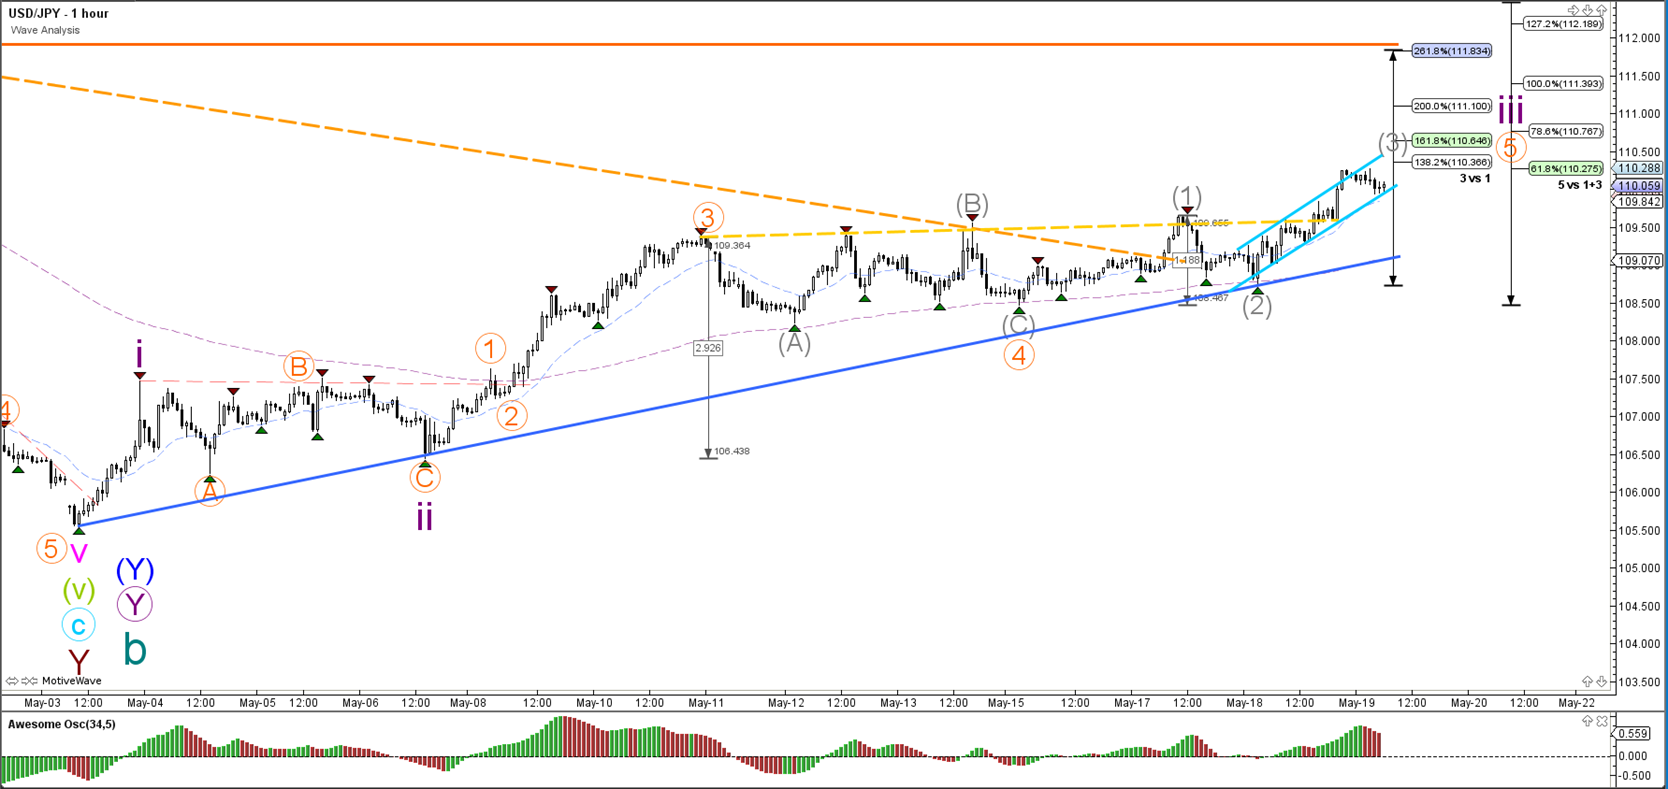
The USD/JPY broke above both resistance trend lines (dotted) and the bullish breakout is moving higher in a trend channel (blue). Price is building a wave 3 (grey) and typically price will move up to at least the 161.8% Fibonacci target before building a wave 4.


Leave A Comment