
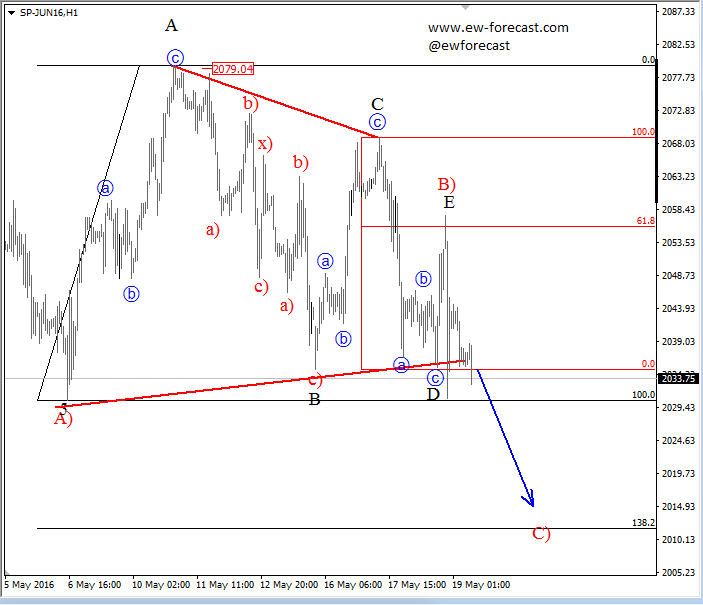
S&P 500 (SPY) looks to be trading in the same situation as the DAX, both showing signs of a complex correction near completion. This complex correction, named a triangle should be completed and we believe that price may go lower towards new potential support levels, which are seen around 2010-2014, where some Fibonacci ratios of 138.2 can project a reversal and end of red wave C).
S&P500, 1H
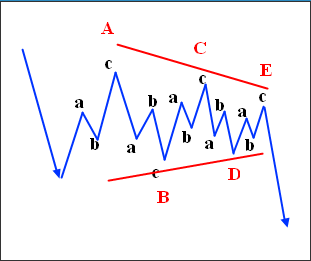
A Triangle is a common 5 wave pattern labeled A-B-C-D-E that moves counter-trend and is corrective in nature. Triangles move within two channel lines drawn from waves A to C, and from waves B to D. Triangles are overlapping five wave affairs that subdivide into 3-3-3-3-3.
A Triangle pattern:


Leave A Comment