
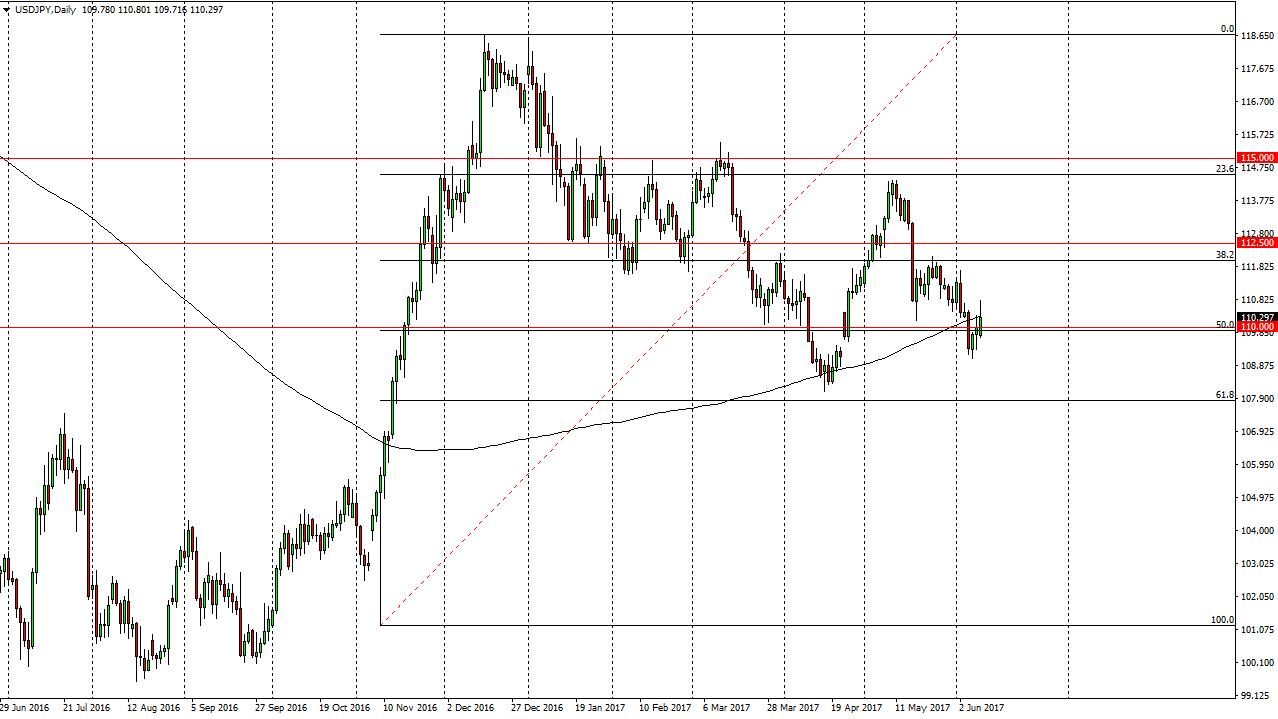
USD/JPY
The USD/JPY pair broke higher on Friday, using the 110 level as a reason to go to the upside. Now that we have broken above there and reached higher, it looks as if the buyers could return. More interestingly, the weekly candle is a hammer, which of course is a bullish sign. Because of this, if we can break above the top of the range for Friday, that would not only be a daily signal, but a bullish weekly candle as well. On the chart, you can see that the 50% Fibonacci retracement level has attracted a lot of attention, and the 200-day exponential moving average on the chart has shown quite a bit of interest as well. I think that the market should eventually go higher, perhaps reaching towards the 112 level, and then the 112.50 level after that. I don’t have any interest in selling currently, but I do recognize that it might be a volatile move.
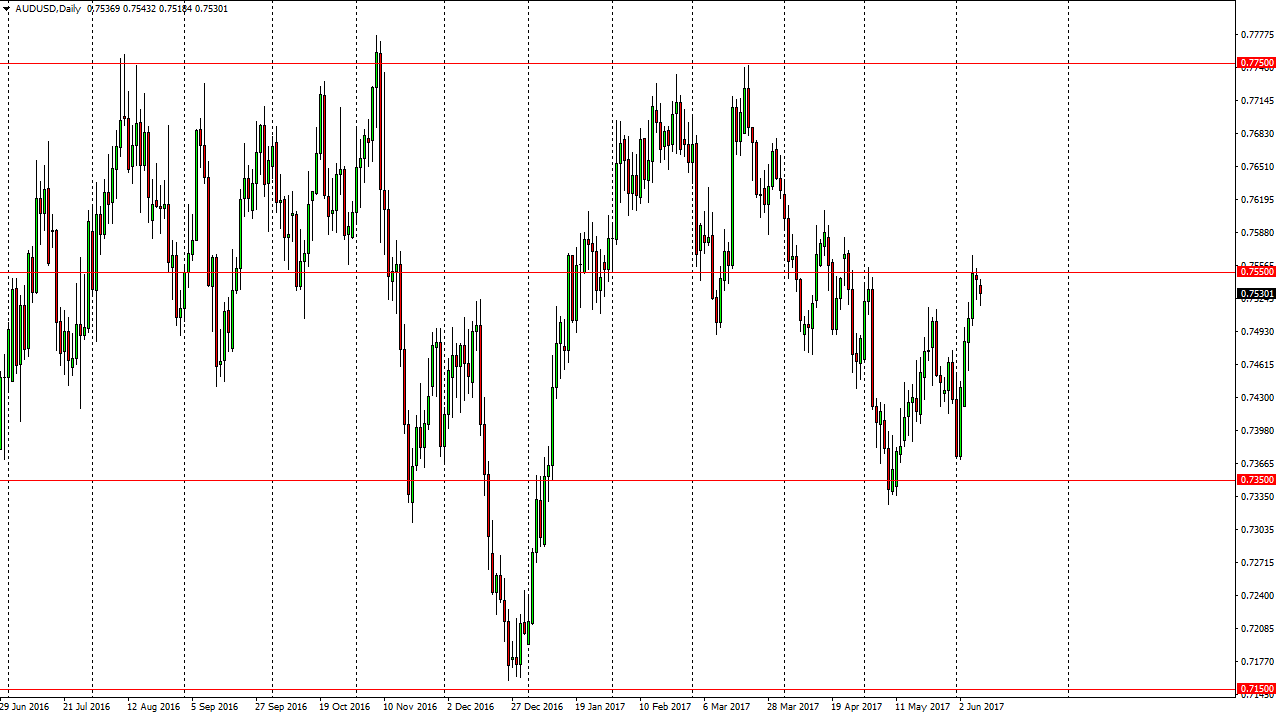
AUD/USD
The Australian dollar fell during the Friday session, but continues to find buyers just below, and especially near the 0.75 handle. The Australian dollar rallied without the help of the gold markets, so that shows a very strong attitude. If we can break above the 0.7550 level, the market should then go higher. If we do get a breakout, I would expect the market to reach towards the 0.7750 level longer term, but of course it will be volatile from time to time. Buying pullbacks on that move will be the way to go going forward, and I would point out that the most recent low is higher than the one before it. I believe that the Australian dollar is starting to show real signs of strength, and because of that I like the idea of buying dips and then simply going back and forth.


Leave A Comment