
Ticker
Last
High
Low
Daily Change (pip)
Daily Range (pip)
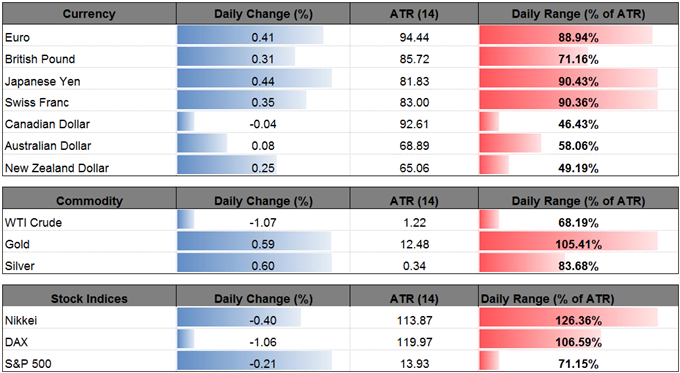
USD/JPY
108.74
109.42
108.68
50
74
USD/JPY remains under pressure going into the last full-week of August, with the pair at risk of extending the decline from earlier this month as market participants scale back bets for three Fed rate-hikes in 2017.
Downside targets remain on the radar ahead of Kansas City Fed Economic Symposium in Jackson Hole, Wyoming as the Federal Open Market Committee (FOMC) adopts a more cautious tone and warns ‘the recent run of soft inflation readings could prove to be more persistent than the staff expected.’ Even though ‘the Committee expects to begin implementing its balance sheet normalization program relatively soon,’ a growing number of Fed officials may show a greater willingness to retain the current policy throughout the remainder of the year as the central bank struggles to achieve the 2% target for price growth.
In turn, the weakness in U.S. Treasury Yields may persist ahead of the next quarterly meeting in September, and the dollar may continue to exhibit a bearish behavior throughout the remainder of the year should Chair Janet Yellen and Co. project a more shallow path for the Fed Funds rate.
USD/JPY Daily Chart
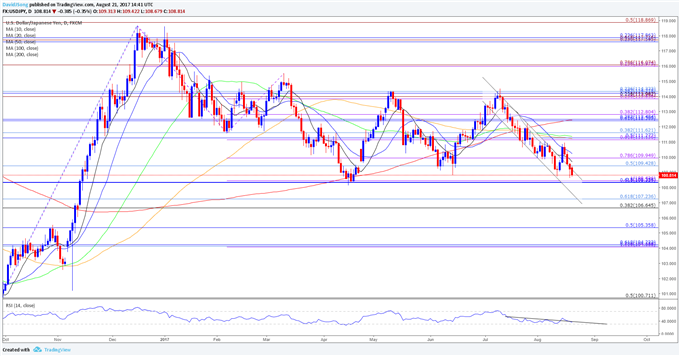
Chart – Created Using Trading View


Leave A Comment