
USD/JPY
4 hour

The USD/JPY is building a potential wave 4 (brown) correction which is moving sideways and staying above the 23.6% Fibonacci retracement level. A bullish break could see a continuation of a bullish 5th wave (brown).
1 hour
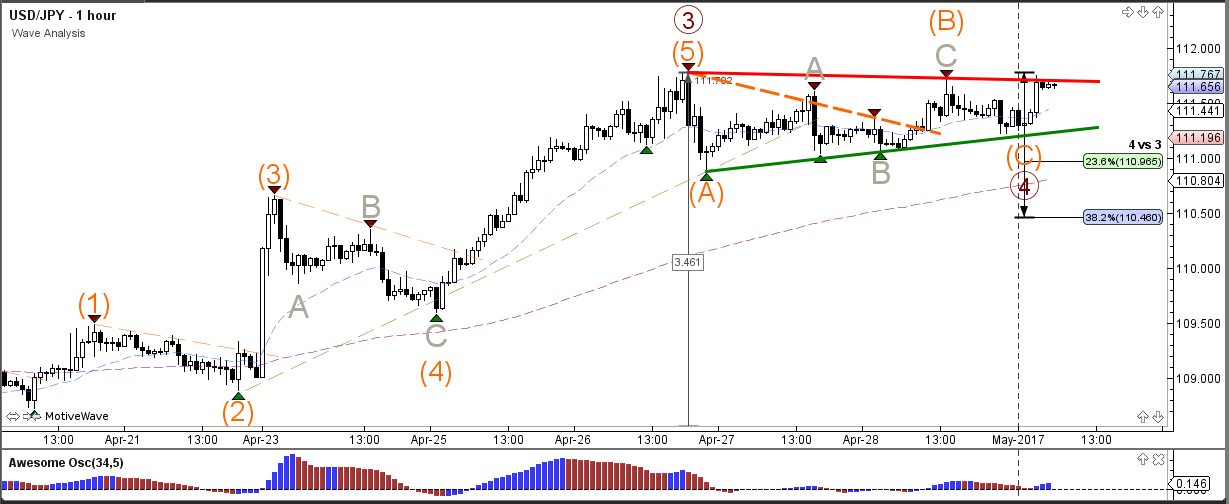
The USD/JPY is building a contracting triangle (red/green) chart pattern. A break below the support trend line (green) could see a larger retracement unfold towards the Fib levels of wave 4 (brown) whereas a break above resistance (red) could see a bullish breakout develop within wave 5.
EUR/USD
4 hour

The EUR/USD could be building a consolidation pattern with support (blue) and resistance (red) trend lines marking the boundaries. A bullish break above resistance (red) would indicate a potential uptrend continuation towards the 78.6% Fibonacci level of wave 2 (green) whereas a bearish break could start a reversal.
1 hour

The EUR/USD reversal pattern did not occur as price failed to break the support trend line (blue) and is extending the correction sideways (red/blue lines). The 123 (red) or ABC (orange) wave counts are possible with a bearish break but become invalidated with a bullish break.
GBP/USD
4 hour

The GBP/USD is continuing with the wave C (orange) bullish momentum towards the 1.30 psychological round level. The 1.30 level could be turn out to be a tough resistance level and potential bounce spot.
1 hour

The GBP/USD could potentially have completed the 5th wave (pink) if price manages to break below support (blue). A failure to break could see an extension of the 5th wave (pink).


Leave A Comment