
EUR/USD
4 hour
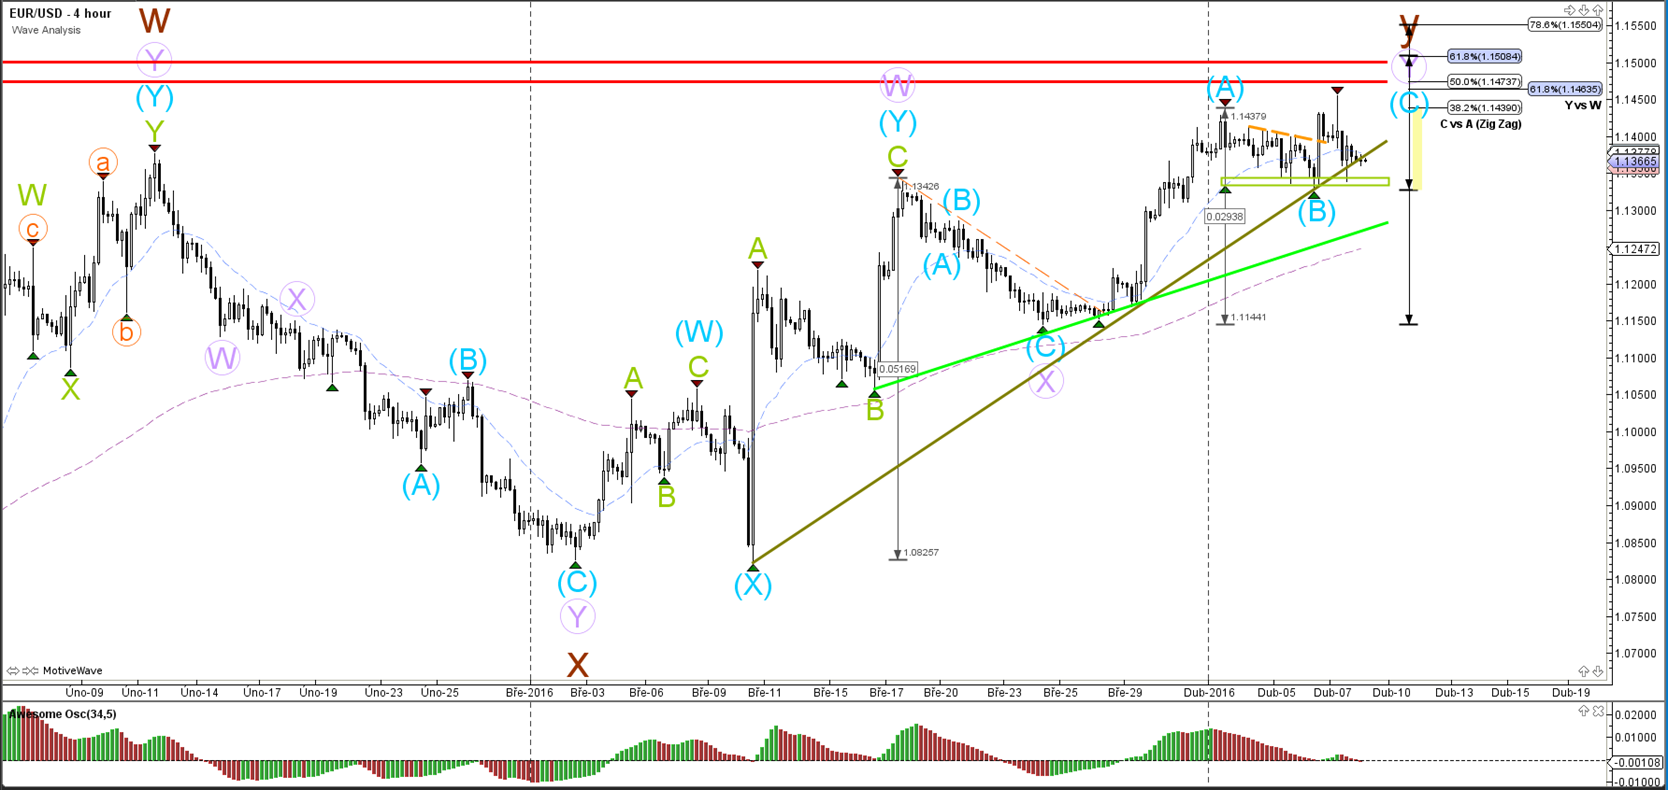
The EUR/USD bullish price action could not break the strong daily resistance zone (red levels) and the psychological round level of 1.15. Price has now moved back to support levels (green), which is a bullish bounce or bearish break spot.
1 hour
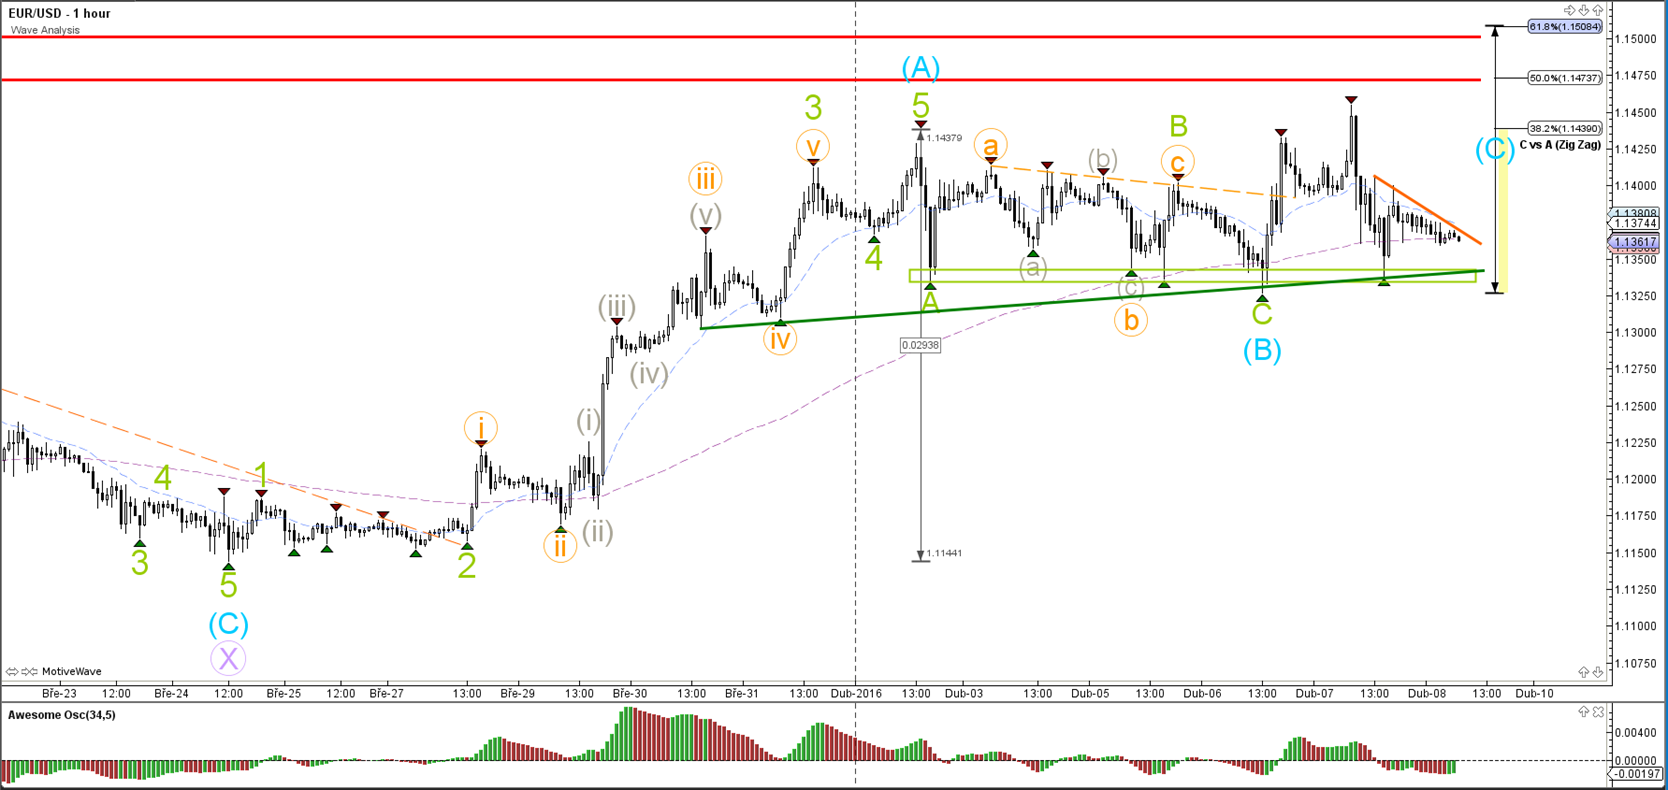
The EUR/USD is now caught in between various support and resistance levels. A bearish break could indicate that wave C (blue) is completed and a bullish break could indicate that wave C (blue) is still developing.
GBP/USD
4 hour
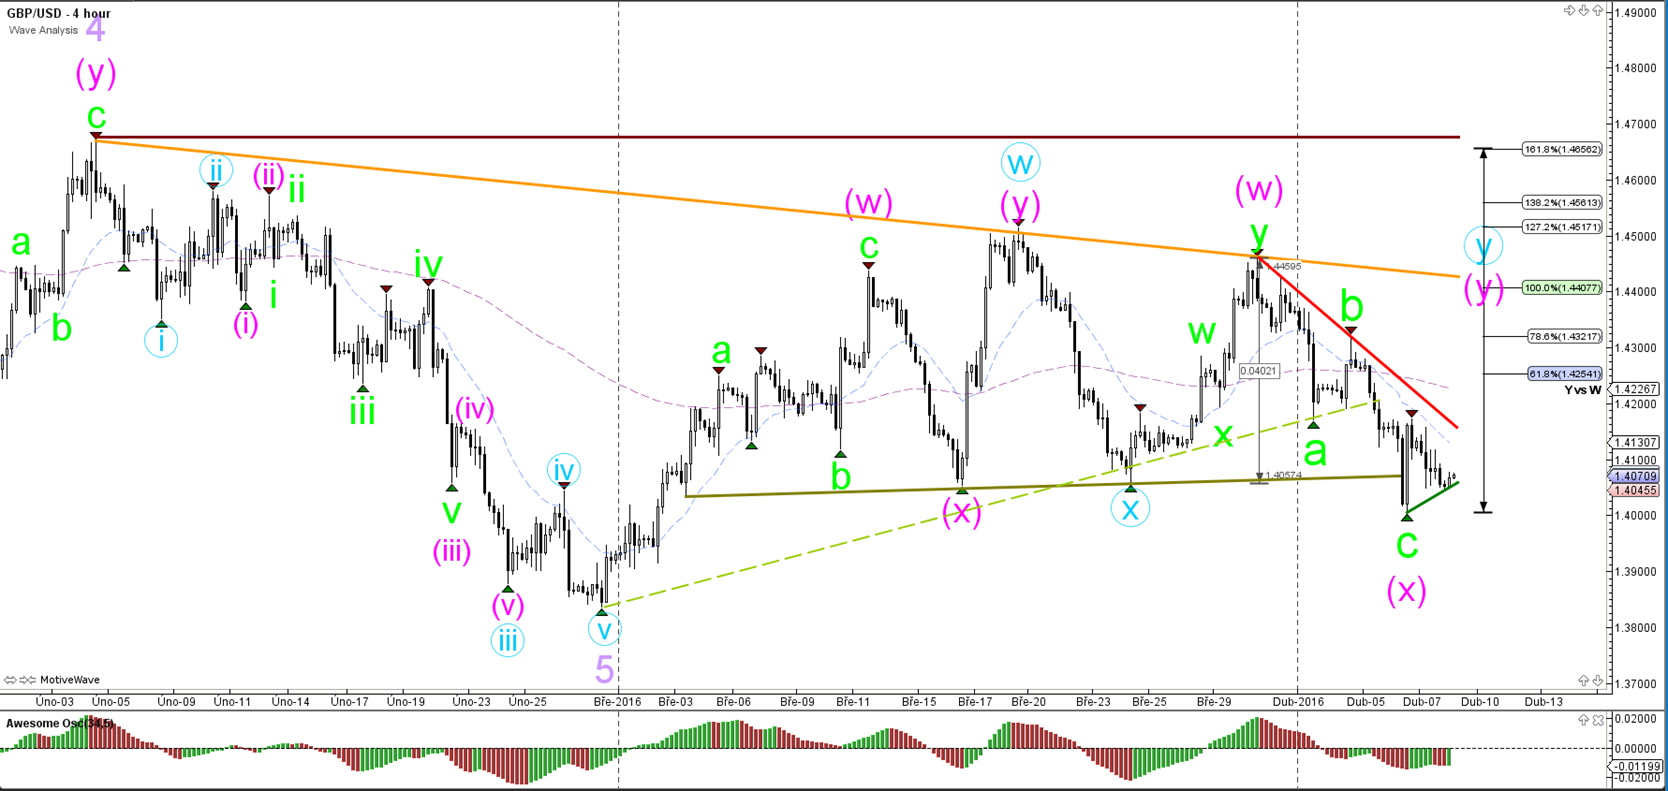
The GBP/USD has support (green) and resistance (red) levels that mark clear boundaries. A break of the resistance could see the continuation of waves Y (pink, blue). A break below support could indicate the continuation of the downtrend which would invalidate wave X (pink).
1 hour
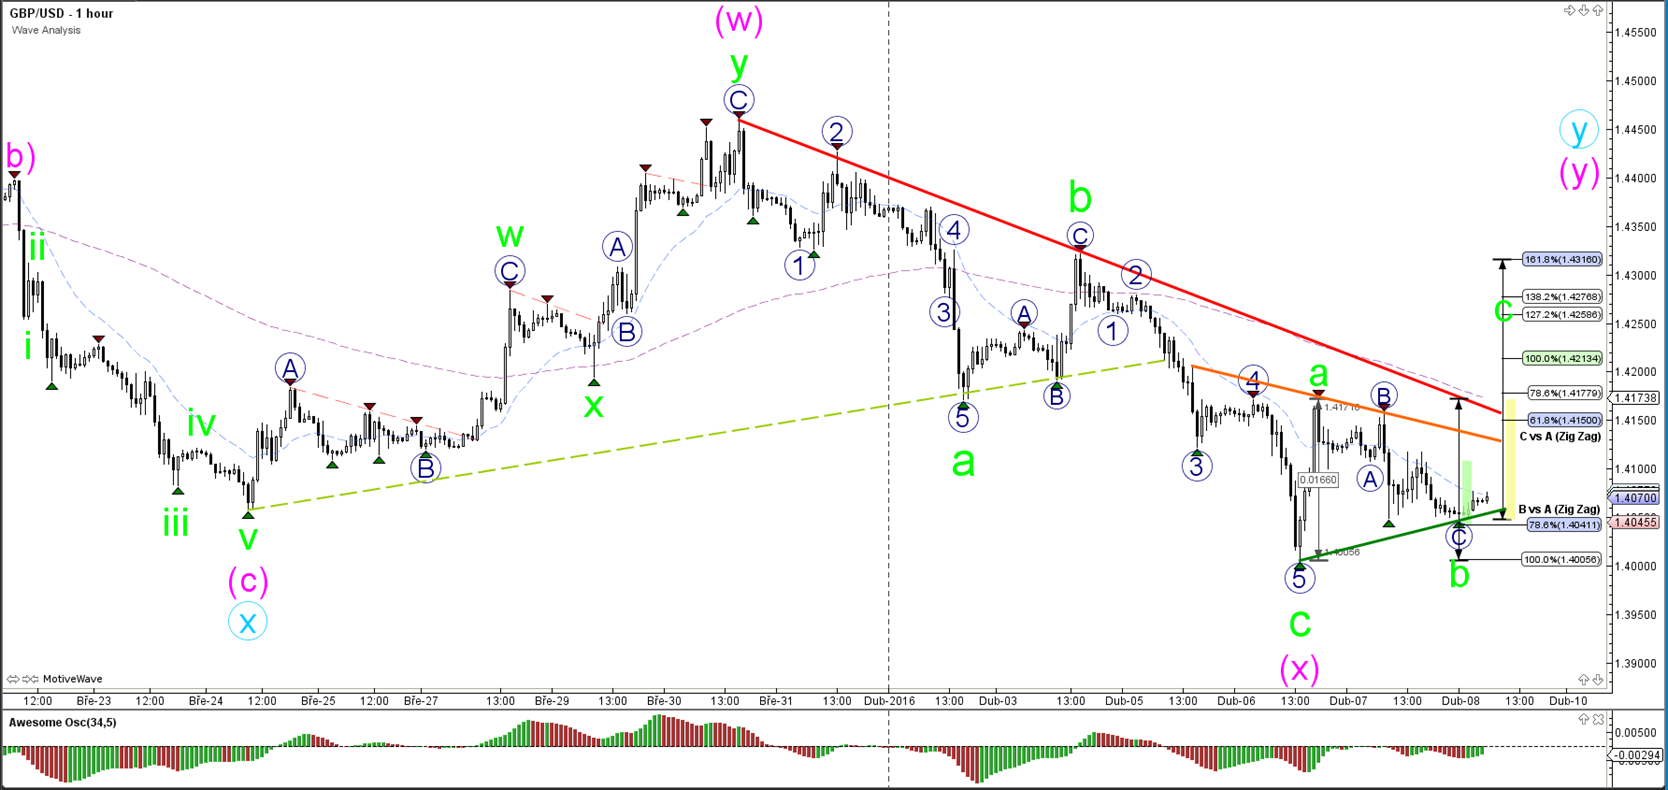
The GBP/USD is building a small triangle (green/orange). and made one more bearish fall. If the bullish zigzag takes place then the Fibonacci levels of wave B and C (green) could turn out to be key levels.
USD/JPY
4 hour
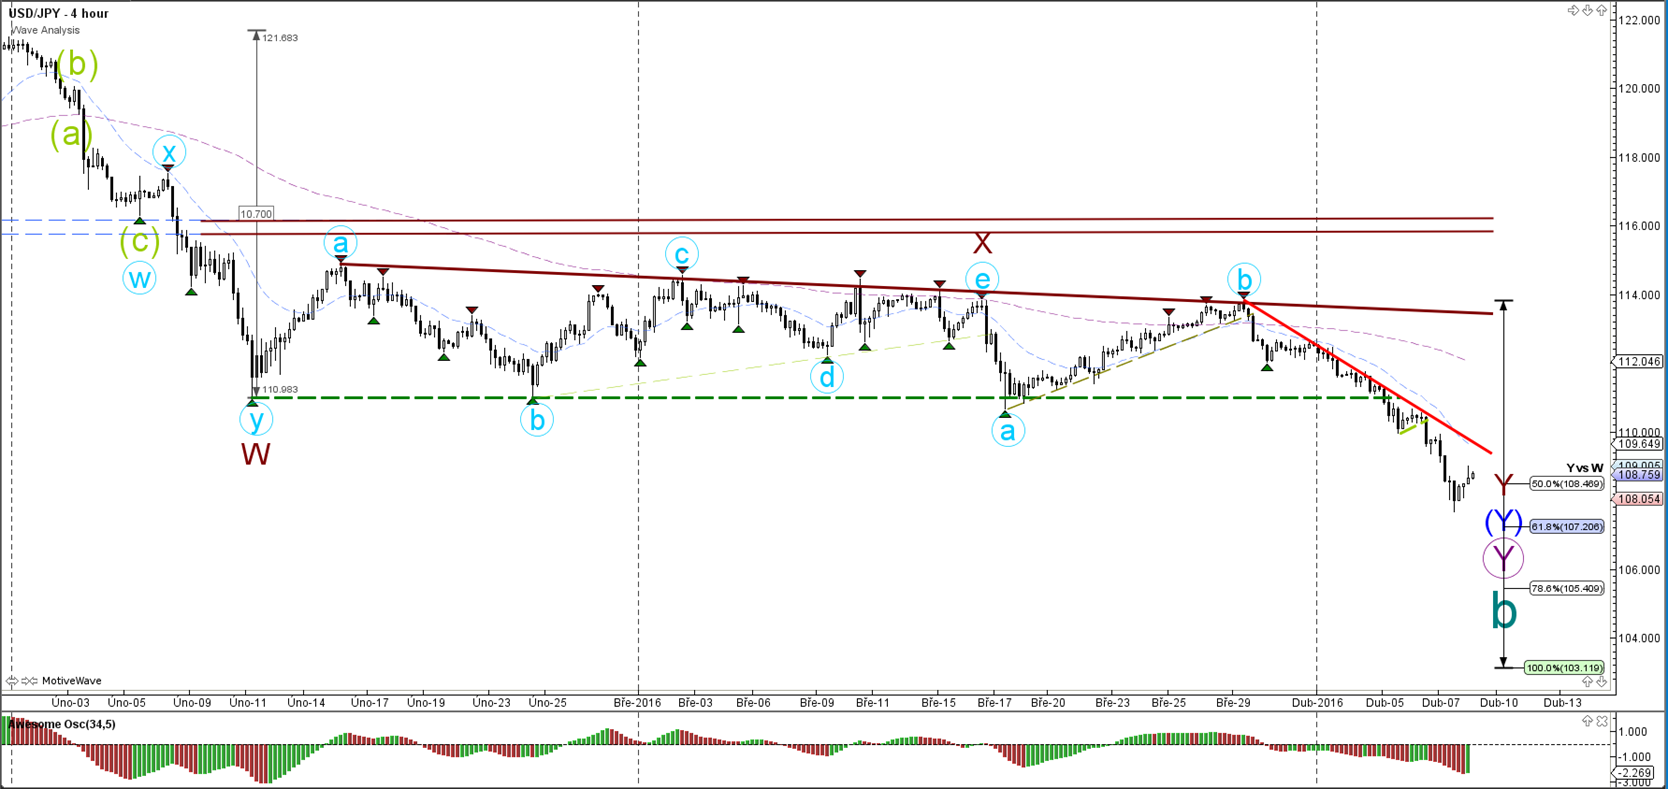
The USD/JPY continued with its strong bearish momentum yesterday. Price could continue to lower Fibonacci targets if price stays below the resistance trend line (red).
1 hour

The USD/JPY completed a wave 3 (orange) and could now be building a wave 4 (orange) correction. The Fibonacci retracement levels could be turning spots for such a potential wave 4.


Leave A Comment