Although USD/JPY came back above the long-term line, we didn’t notice significant increases in the following days. Will this show of currency bulls’ weakness result in another repetition of what we already saw in the past?
EUR/USD

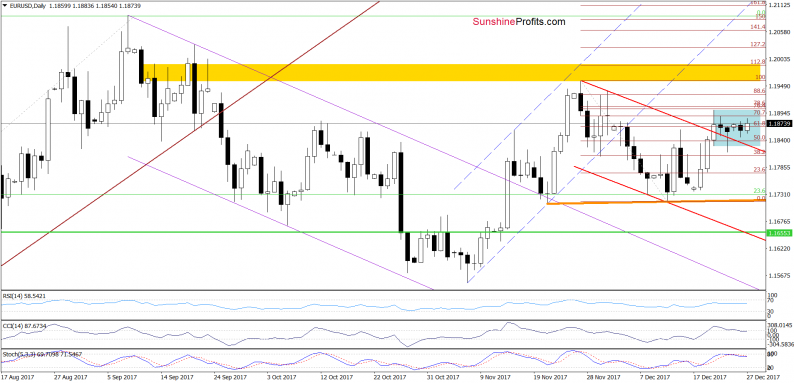
Looking at the daily chart, we see that the overall situation in the short term hasn’t changed much since our last Forex Trading Alert was posted as EUR/USD is trading in the blue consolidation. Such price action makes the picture a bit unclear, however, the CCI and the Stochastic Oscillator generated the sell signals and the exchange rate remains under the resistance zone created by the 76.4% and 78.6% Fibonacci retracements, which suggests that the next move will be to the downside.
Nevertheless, such price action will be more likely and reliable if we see a drop below the previously-broken upper border of the red declining trend channel and the lower line of the blue consolidation.
What could happen if we see such developments? In our opinion, the pair will extend declines and test the orange support line based on the previous lows in the following days. This pro bearish scenario is also reinforced by the broader picture of EUR/USD.
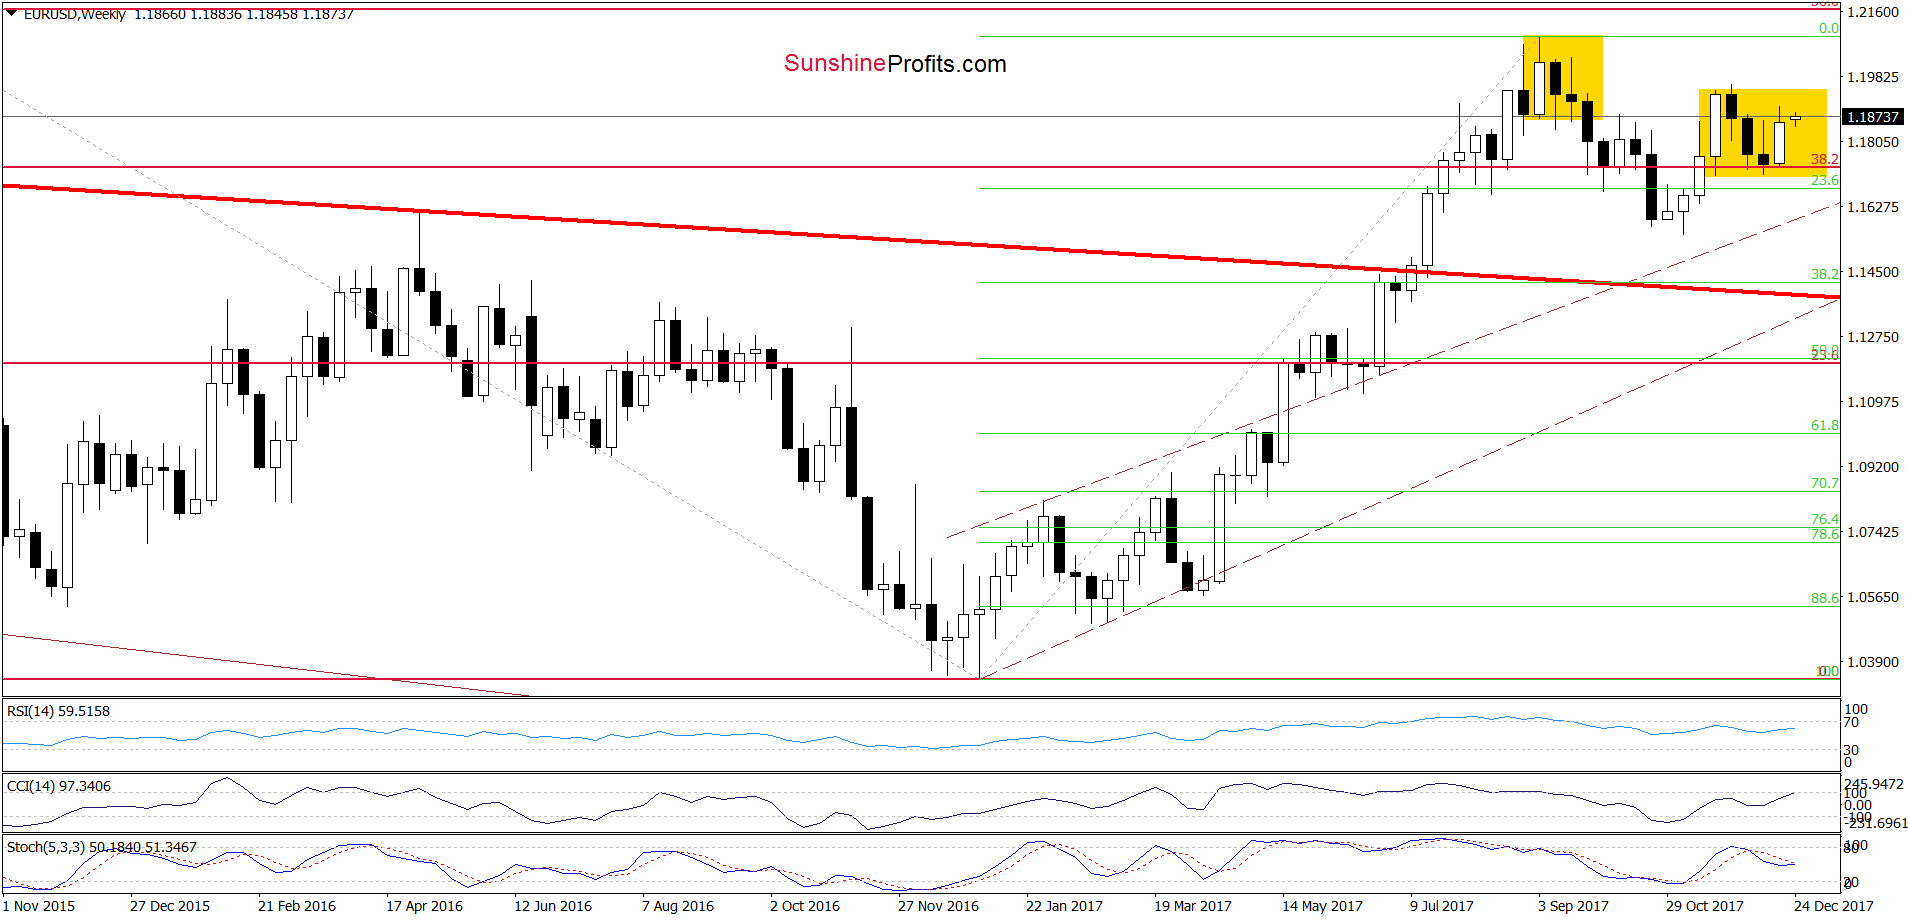
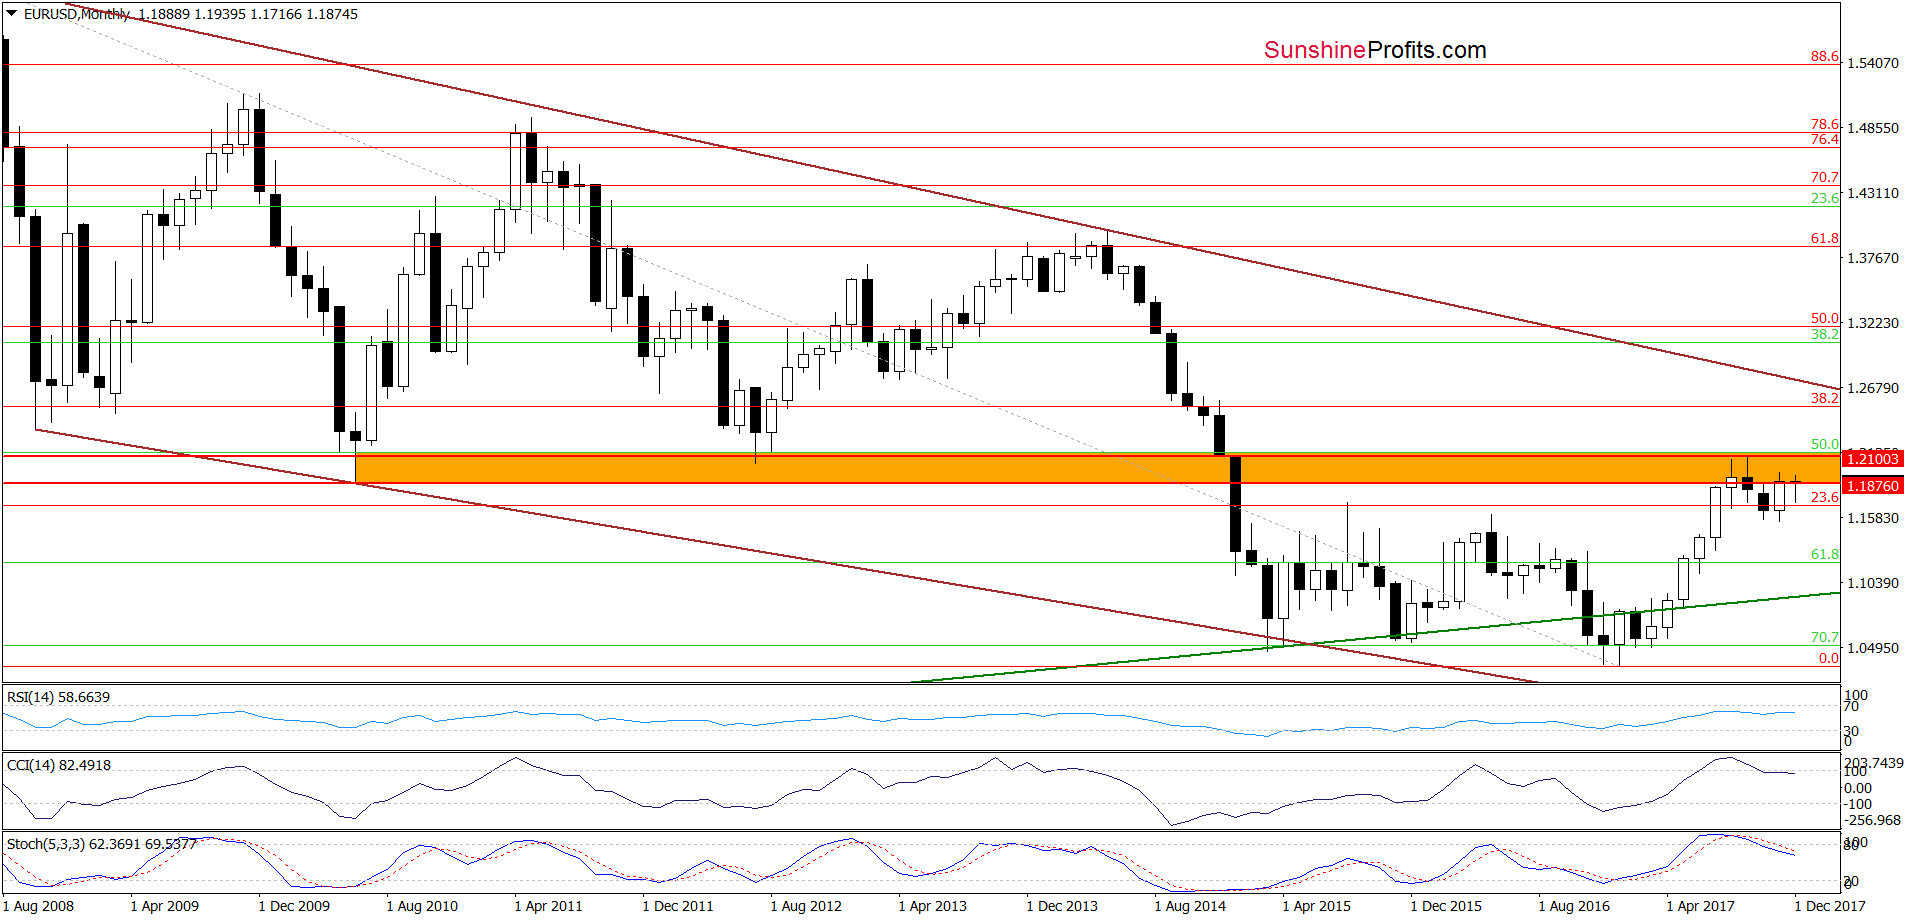
As you see on the charts below, the exchange rate remains in the yellow consolidation under the orange resistance zone, which together with the sell signals generated by the weekly and monthly indicators (marked on the charts below) increase the probability that another move will be to the downside.
USD/JPY
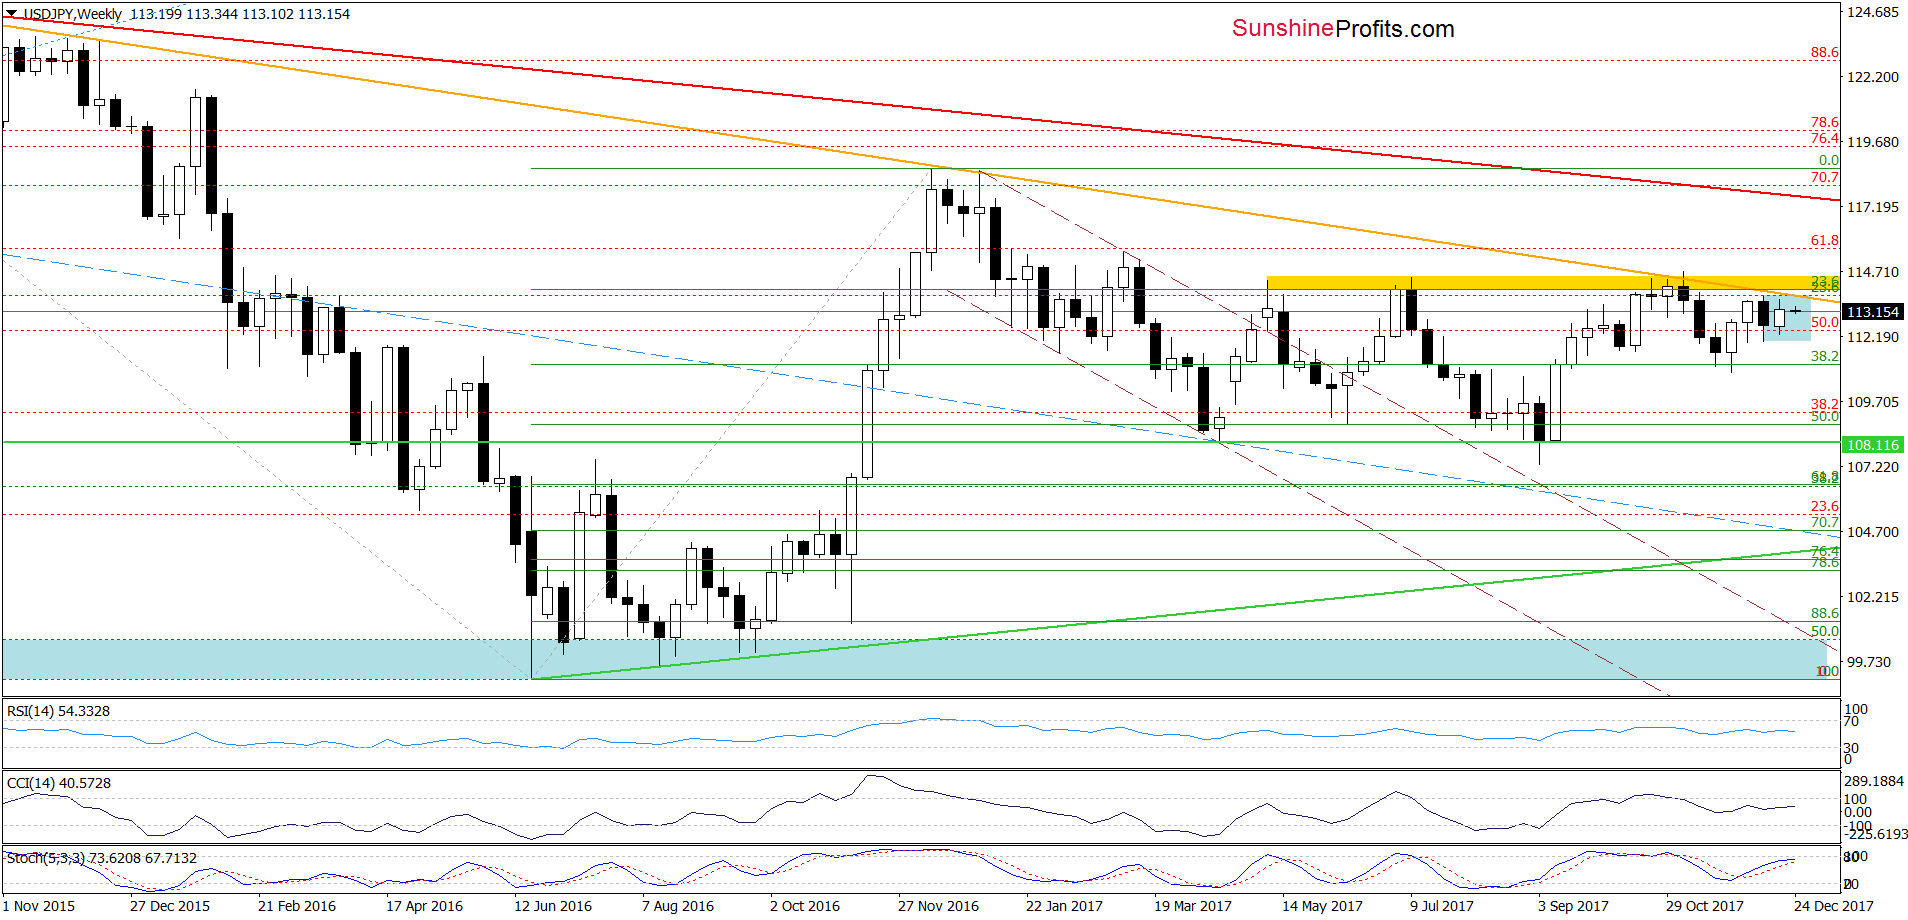
From the medium-term perspective, we see that USD/JPY is trading in the blue consolidation under the yellow resistance zone and the orange declining resistance line, which together continue to block the way to higher levels for many weeks.
Will we see another attempt to break above this resistance area in the coming days? Let’s examine the very short-term chart to find out.


Leave A Comment