One of the most important jobs of a market participant is risk management. If you’re unable to identify when your position is wrong, then you shouldn’t be entering a position, to begin with. Would we ever enter a crowded room without identifying where the exits are? I don’t think so. We have the same responsibility when entering a new position. At 360 Investment Research, when we enter a new position, we identify risk (and potential reward) by looking left. By looking left on a price chart, we can identify previous changes in supply and demand, which can give clues on where demand or support could appear. In a previous post, we used this simple technique to identify important levels on the S&P 500, one of the most watched indices and favorite proxy for discussing the U.S. stock market overall. By looking left, we can identify when buying momentum wanes and when selling pressure has entered the market. For example, if over a certain time period, a price is making a series of lower highs and lower lows, we know sellers have more urgency than buyers for that time period. There is more supply than demand and price is trying to discover where the buyers live. So by looking left, we are using economic law (not opinion) to guide our investment decisions, entries, and exits. Using price removes mystery (and emotion) from our trade book. Let’s go through this exercise with the S&P 500 on daily and weekly time frames to identify where we are with the current market.
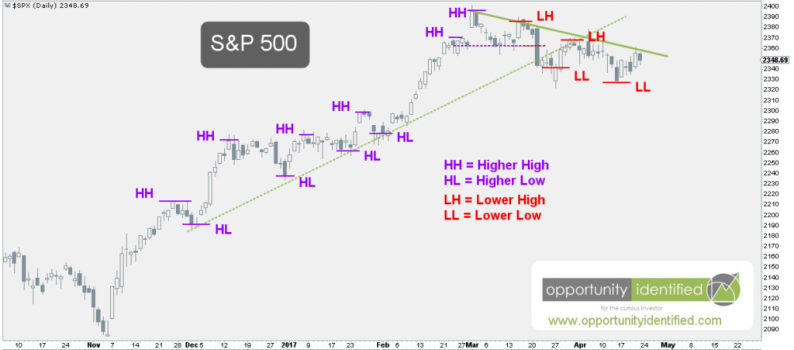
First, here’s the daily chart of the S&P 500:
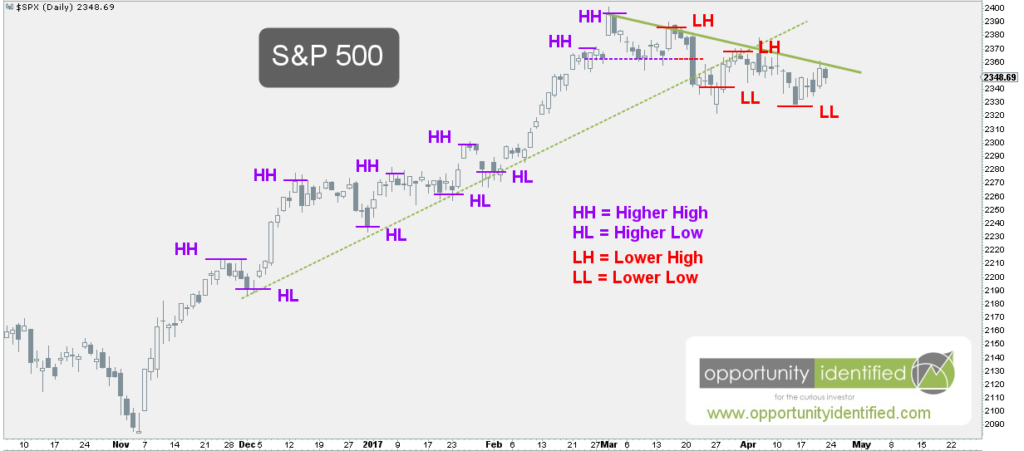
When we look left, we can see price made of series of higher highs and higher lows from November through March. On March 1st, this important index recorded a new all-time-high. A series of higher highs and higher lows is indicative of a bull market. Since then, however, the characteristics have changed. They S&P 500 has recorded a series of lower lows and lower highs. Until this sequence is broken, the S&P 500 is in a downtrend on a daily timeframe. There’s no sugar coating it. Facts are facts and we’re not entitled to our own facts. Until the S&P 500 records a higher high and higher low, it’s in a downtrend on a daily timeframe. A good start towards this effort would be a close above the downward momentum trendline (in solid green). In addition, a close above 2368 would lock in a higher high with only a lower low needed to confirm an uptrend sequence.


Leave A Comment