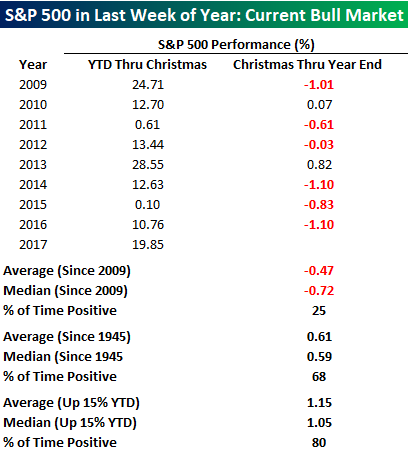
When it comes to the stock market, the period before and after Christmas has historically been a great time of year to be long equities. After all, the term Santa Claus Rally didn’t just come up out of nowhere. Recently, though, not so much. Despite being in one of the longest and strongest bull markets on record, the last week of the year between Christmas and New Years has been more Scrooge than Santa. The table below lists the performance of the S&P 500 for each year during the current bull market from the start of the year through Christmas and then from Christmas through year-end.
Since the bull market began in 2009, there has not been a single year where the S&P 500 was down YTD as of Christmas, but there have only been two years where the index traded in the black from Christmas through year-end. Overall, the index’s average return in the last week of the year has been a decline of 0.47% (median: -0.72%). That’s not the way it has always been, though.In the interest of space, we didn’t list every year, but we have included the results in the table, and since 1945, the S&P 500 has seen an average gain of 0.61% (median: 0.59%) in the last week of the year with gains over two-thirds of the time. Finally, with the S&P 500 up close to 20% in 2017, we also looked at the index’s performance in the last week of the year when it was already up at least 15% YTD.In those 25 years, the S&P 500 saw an average last week gain of 1.15% (median: 1.05%) with gains 80% of the time. Those are some pretty consistent results, but here again, we would note that in the current bull market, the results haven’t been as positive. Since 2009, there have been two years where the S&P 500 was up over 15% YTD (2009 and 2013) as of Christmas.In 2009, the S&P 500 traded down 1.01% in the last week of the year, while in 2013 it finished the year with a gain of 0.82% in the final week.


Leave A Comment