
(with additional contributions from Margie Fernandez; edited by Joe Calhoun)
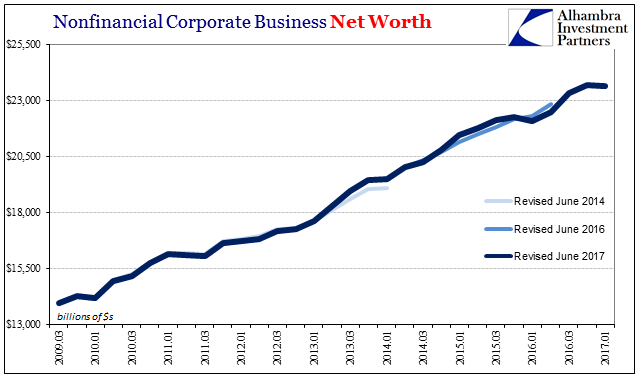
The Net Worth of Non-financial Corporate Business declined slightly in Q1 2017 according to the Federal Reserve’s Financial Accounts of the United States (Z1). The revised quarterly figures suggest that economic net worth eased to $23.62 trillion after a record high $23.69 trillion in Q4 2016. That likely relates to economic weakness to start the year, though not of any lingering concern given what is a well-established upward trajectory.
In using corporate net worth to estimate equity market valuations, however, the quarterly stumble means that under Tobin’s Q, valuations would rise sharply. The Z1 statistics estimate that the market value of corporate equities rose, gaining $1.18 trillion in Q1 alone. That was the largest quarterly increase for equities since Q4 2013. Truly “reflation” repeats.
The Q ratio, which had dipped under 1.0 for each of the past six quarters of the “rising dollar”, blows back above that mark being calculated at 1.04 for this latest period. It brings this measure of equity valuations back up to where they were at the start of 2015.
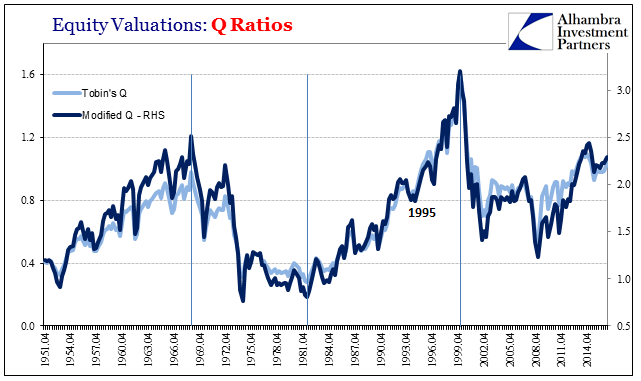
Our modified Q ratio, subtracting the market value of corporate real estate holdings from net worth, also rose sharply despite a small gain for estimated CRE. By whichever Q valuation measure, the market is pushing back toward levels comparable only to the dot-com era or the peak period at the start of the Great Inflation.
Other valuation methods show the same extreme levels. Robert Shiller’s cyclically-adjusted P/E is at its highest since March 2002. At more than 30 times adjusted earnings, that is about the same as valuations in the middle of 1997.
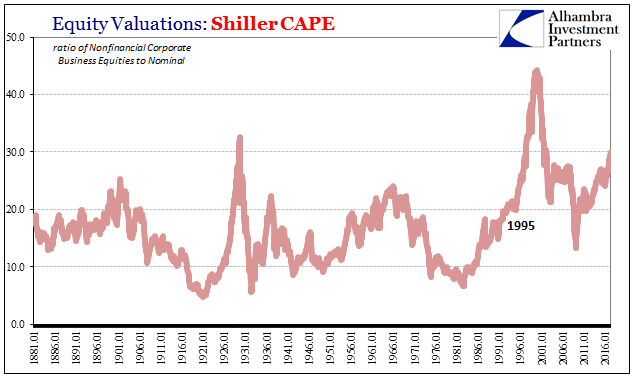
The use of CAPE as a comparison tool has been criticized lately – it’s different this time – but the real value in Shiller’s data is its length. Comparing valuations across 125 years of data gives one greater historical perspective.


Leave A Comment