Talking Points:
– Last week saw a reversal of USD-strength as geopolitical tensions around the Korean peninsula moved into the spotlight.
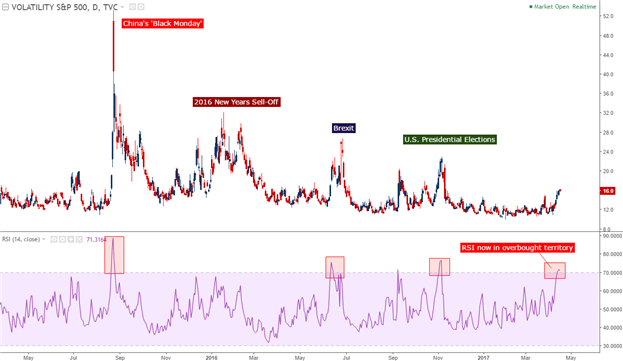
– This has created a move-higher in the VIX (the ‘fear and greed index’); but the last couple of those instances turned-into aggressive rallies-higher. Is this time different?
This week is relatively light on the data front, with the main point of allure having already been published with Chinese GDP coming in above expectations, printing at 6.9% versus an expectation of 6.8%. But geopolitical drivers will likely remain as the primary point of emphasis for global markets, as a Turkish referendum combined with the situation on the Korean peninsula continuing to illicit attention from market participants. To quantify this mounting pressure, we’re looking at VIX below, and notice that we’ve just moved into over-bought territory via RSI. This happened most frequently just ahead of the Brexit referendum and then again ahead of the U.S. Presidential election.

Chart prepared by James Stanley
While it’s very possible for VIX to continue rising as equity prices continue to slide, given the reaction of the past couple of instances in which VIX moved-overbought very quickly, traders may want to look at this as more of a fade opportunity than a continuation setup of weakness in U.S. stocks.
S&P 500 Testing the March Lows – 2017 Fib Retracement Setting Support & Resistance
With that recent expansion in volatility has come a move-lower in the S&P as the index is now testing its March low at 2,321, and just below that we have the 50% Fibonacci retracement of the 2017-move. This creates a zone of potential support in the 5-handle range from 2,316-2,321; and just above current prices is an area of short-term resistance around 2,336, which is the 38.2% level of that same Fibonacci retracement while also being prior price action support.
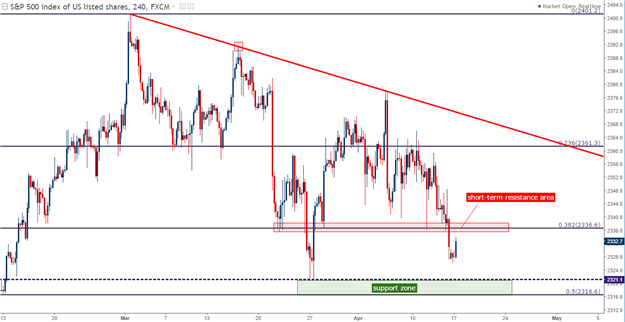
Chart prepared by James Stanley


Leave A Comment