The markets continued their record-setting trends of new highs and record low volatility this week. This comes despite continued signs that the economy has passed its peak for this cycle, even at a time when the geopolitical arena is anything but peaceful. On Wednesday the Dow closed above 23,000 for the first time ever and as of Thursday’s close has made 51 new record highs in 2017. Global stocks hit new all-time highs Friday morning with Japan’s Nikkei 225 Stock Average up for the 14th consecutive day, matching the index’s longest winning streak on record.
While the market continues to melt higher, Thursday marked the thirty-year anniversary of Black Monday, the single worst one-day market crash in history when the Dow plunged 22.6% on volume that was nearly double the prior record. In the days leading up to Black Monday, the market had already lost 11%, which meant the Dow lost 34% in just ten trading days. In contrast, on October 10th, 2008, the single worst trading day during the financial crisis, the Dow fell just 7.9%.
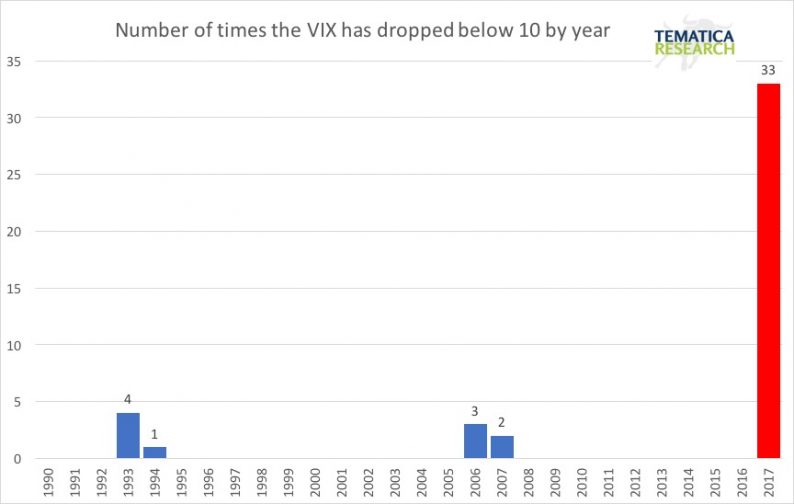
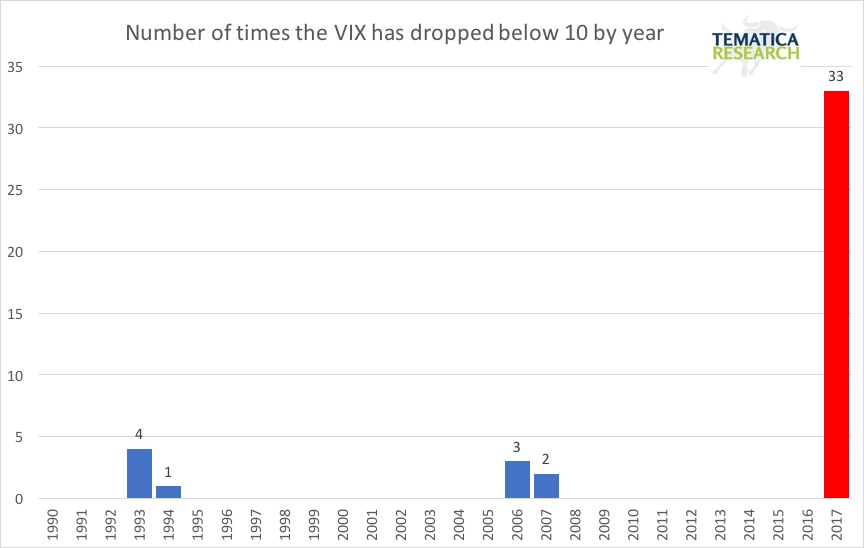
October has historically been the market’s most volatile month, yet October 2017 is on track to be the least volatile month in history. Yes, you read that right. Not only is this the least volatile October so far, but the least volatile month EVER. The Dow has not experienced a down day of 1% or more in 43 sessions, with its average daily move this year in absolute terms less than half the norm. The chart below just gets more and more staggering with every passing week.
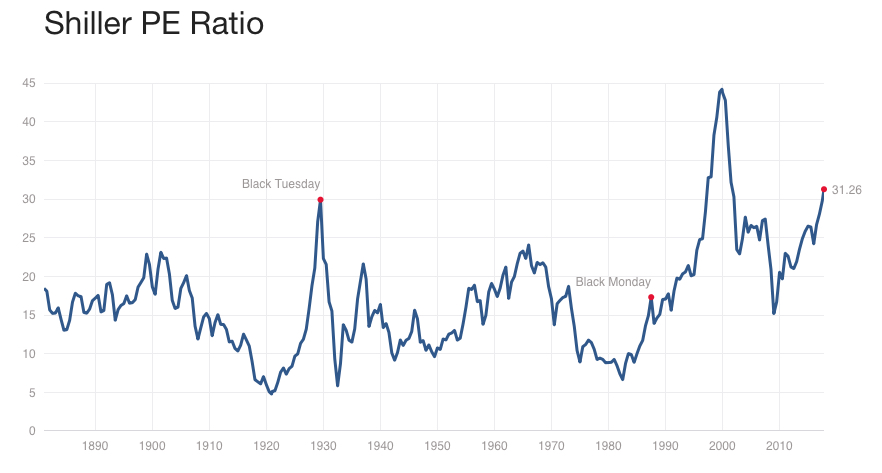
Valuations are also making records – while the S&P 500 is getting a nosebleed trading at more than 19.5x expected 2017 earnings, the Shiller Cyclically Adjusted PE ratio reaching 31.2, moving above the 1929 peak of 30. The only time this measure has been higher was when it reached 44.2 during the dotcom “this time it’s different” mania.
On Thursday the S&P 500 opened down around 0.5%, but in the seemingly eternal melt up, managed to close at yet another new all-time high. As of that close, the S&P 500 has gone 349 trading days without a pullback of 3% or more. If the low volatility and melt up continues for just 22 more trading days, this will be the longest streak on record going back to 1928. The Dow’s 14-day relative strength index is at levels exceeded only 0.1% of the time in the past 100 years – talk about a high-altitude market– but we’ve been at such heady heights four other times since the November election. This year is one for the record books.


Leave A Comment