
There is so much on the calendar next week that it is impossible to choose a single theme. The economic calendar includes all the major reports. It is still the heart of earnings season. Announcements are expected about a new Fed Chair (and perhaps other appointments), the tax reform proposal, and Special Counsel Mueller’s first indictment. The actual Fed rate decision, often the major focus, is almost an afterthought.
It is a paradise for the punditry.
Last Week Recap
In the last edition of WTWA I guessed that there would be plenty of discussion about the lack of fear in markets. That was a reasonable guess as well as an interesting topic to consider. Evidence of the focus on fear came from Wealth Advisor, which teed up a week-old story featured earlier by Business Insider. I had bookmarked this last week for more complete attention, but I was alarmed by an email showing the most popular stories.

The original story was based on an interview with John Hussman who explains every week that the stock market is “overvalued, overbullish, and overbought.” He explains that Mr. Buffett does not really understand the relationship between stock prices and interest rates, and discusses the interest effect on future cash flows. This completely misses the Buffett point, which compares the attractiveness of various assets. A balanced story would have done a better job of explaining the Buffett viewpoint, but it is always popular to predict a 60% market crash.
Trivia question: When is the first time Dr. Hussman used the phrase “overvalued, overbullish, and overbought?” At some point he added “obscene.” Answer at the conclusion of today’s post. Hint: If you read the story on your mobile, you were using the iPhone 4!
The Story in One Chart
I always start my personal review of the week with a chart. This week I am using a chart of the S&P futures from Investing.com. If you visit the page, you can readily change chart style and time frame. The futures show you the overnight action as well as the trading during the day. The “N” indicators will show relevant news if you hover over them.
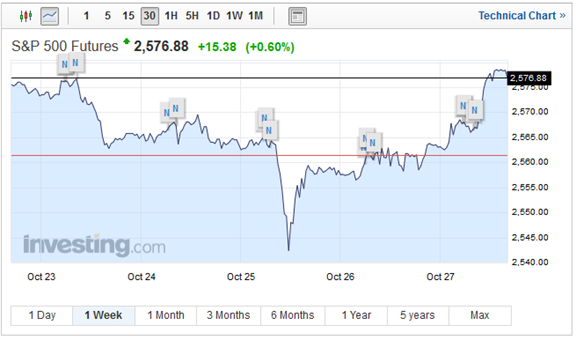
The change on the week was modest, as it has been in many prior weeks, but it adds up to another new record. Once again, notice that the volatility has been very low. The intra-week range was less than 1.5% and the weekly change only 60 bps. Those who believe that the VIX should be signaling more fear should realize that it has been anchored by the continuing low volatility in the underlying stocks.
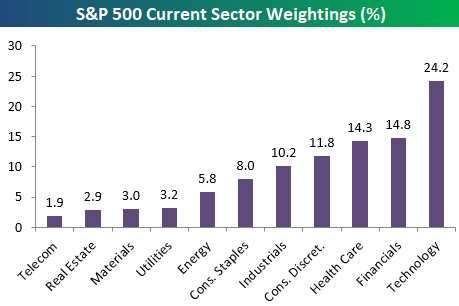
Much of the gain was in the technology sector, which now constitutes 24.2% of the S&P 500. (Bespoke)
Eddy Elfenbein reports an amazing research result:
If you take all the days when the S&P 500 moved more than 1.14% in a day, up or down, the combined return comes out to zero. They completely balance each other out.
The entire return, more than 55-fold over 60 years, comes on the low-volatility days (up or down less than 1.14%).
Would you have guessed that?
The News
Each week I break down events into good and bad. For our purposes, “good” has two components. The news must be market friendly and better than expectations. I avoid using my personal preferences in evaluating news – and you should, too!
The economic news has been mostly positive.
The Good
The Bad
Following Up
Last week some readers were skeptical about the poll I cited showing pollution concerns. Statista’s data from The Lancet and NPR shows the overall deaths from pollution.


Leave A Comment