
One month after the February stock market rout is an excellent time to step back and review all the facts – and their implications for the gold market. Here’s exactly what happened – and what it implies for your capital allocation.
In the “old days,” when good news was reported, the Stock Market would go up. Today, when good news is reported, the Stock Market goes down.
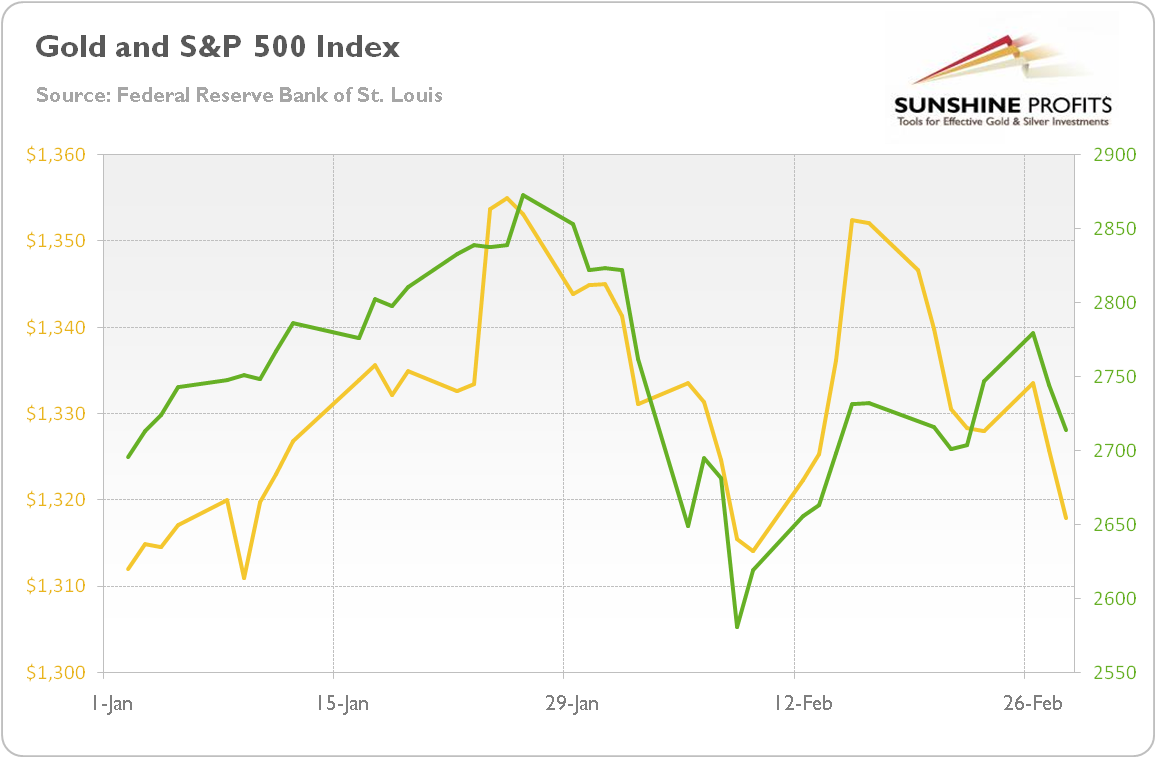
Chart 1: Gold prices (yellow line, left axis, London P.M. Fix, in $) and S&P 500 Index (green line, right axis) from January 1, 2018 to February 28, 2018.
These are facts. But what do they imply for the future? Are they changing the economic outlook? Not really. First of all, fears of inflation are clearly exacerbated. Just look what happened to the oil prices in February. It doesn’t suggest that enormous inflation is coming. And it doesn’t bode well for bullion, given the strong correlation (almost 0.6 – see also the chart below) between the yellow and black gold in 2018.
Chart 2: Gold prices (yellow line, left axis, London P.M. Fix, in $) and oil prices (black line, right axis, WTI, in $) from January 1, 2018, to February 26, 2018.


Leave A Comment