
This week’s Market Outlook is late because I needed to figure out the data behind the market secret covered below.
As traders or investors, we can probably agree on the fact that too much of a good thing usually doesn’t end well.
However, an ‘overbought’, or ‘over exuberant’ market can also be indicative of more good things to come.
So which is it right now?
Has Trump’s mantra of let’s ‘Make America Great Again’ translated into stocks?
Or is the ‘Trump bump’ a short covering, naive bull rally that will go the way of his Atlantic City casinos (bankrupt)?
Fortunately, we don’t need to make such predictions, because the market will tell savvy traders in ways like this…
1. MarketGauge’s automated ETF Sector model showed that the market believed two sectors would rally regardless of the election’s outcome – Financials and Transportation (for more on how and why we knew this, watch this training before it expires on Sunday night)
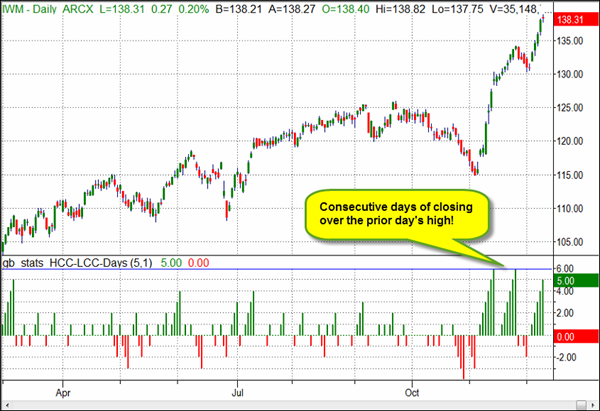
2. A simple pattern, which could be the single most powerful one-day indication of the future trend in the market that I’ve found in my 26 years of trading, reveals the market’s bias.
The pattern is simply…
Did the market close over the prior day’s high?
In the right context (that’s the real secret), this will tell you what’s going to happen next, but…
Sometimes the market does unusual things, and in the current condition, historically speaking, too much of a good thing MIGHT be problematic.
That’s where this week’s delayed release of Market Outlook comes in.
Specifically, the SPY and the IWM have closed over their prior day’s high for 5 days in a row!
The mainstream media will report the number of up days in a row, but they are not yet aware of this pattern (please don’t tell them).
Five days in a row of a close over the prior day high is highly unusual!


Leave A Comment