

Bitcoin is still considered the currency of the Dark Web, despite the fact that it was the world’s best performing currency in the recent two years. Now one Bitcoin is worth two ounces of gold which is significant in the financial world as the digital currency continued it’s outstanding performance with +150% year-to-date. However, there has been a lot of headlines lately as the world’s new favorite cryptocurrency Ethereum stole the show with an outstanding +5,000% rise in value since January before the price stabilizing around +3,000%.
Moving on to the technical charts, we’ll be using Elliott Wave Theory among other tools like distribution and cycles to help us identifying the potential path for both of the crypto-currencies and prepare traders and investors for the next move according to these scenarios.
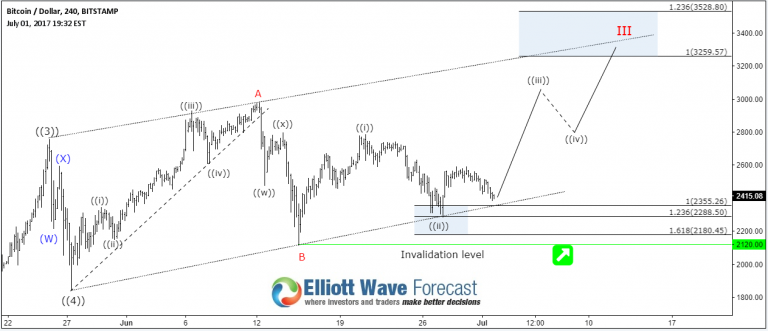
BTCUSD cycle from 2015 lows is still in progress, the instrument found support each time it did a corrective pullback in 3 , 7 or 11 swings and currently it has the potential to add another leg higher toward $3250 – $3500 at minimum before ending wave III. However we need to keep in mind that the third wave is usually the strongest one and can keep extending to the upside. Consequently, it’s not recommended to sell it and until the pivot at 06/15 low (2120) gives up you should keep trading with the main bullish trend.
Bitcoin 4H Chart
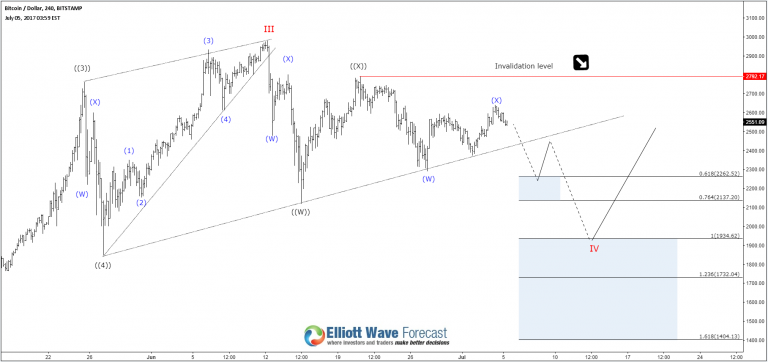
If the pivot at 2120 low gives up and Bitcoin manage to break below the ascending trend-line then wave III could be already in place. In that case, it will be looking to make a double three correction to the downside from June peak and look to reach $1930 – $1725 which will represent the next buying area for a 3 waves bounce at least.
Bitcoin 4H Alt Chart
The overall picture for Bitcoin remain bullish and it will either rally from current levels or extend the correction before buyers show up again. So there is no need to panic about a deeper pullback and try to focus on the bigger picture.


Leave A Comment