
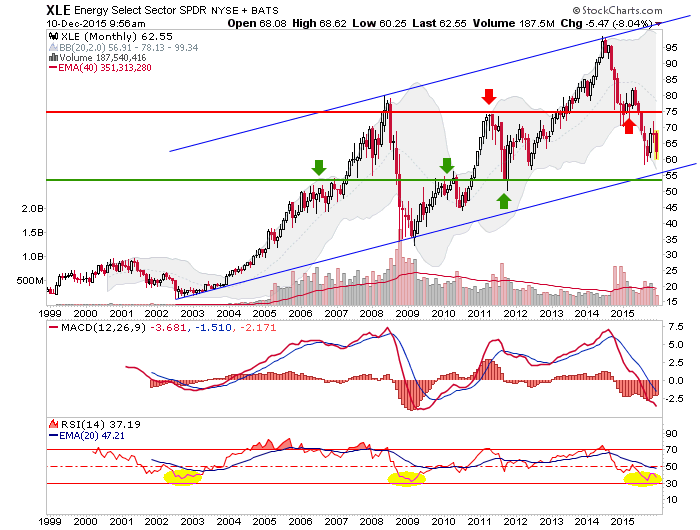
This is an old NFTRH+ chart of the monthly XLE. There have been some false alarms and bounces on daily charts, but we used the monthly as the moderator. It has been likely to register the bottom channel line and/or lateral support (i.e. the 54 to 57 range), but it is in a bull market, and a secular one at that. And I am no commodity bull, as you probably know.
Armageddon has visited the U.S. energy sector as the headlines are full of Saudi plans to destroy the Fracking industry and along with it, America’s supposed energy independence. Oil is supposedly being manipulated lower as a tool toward this outcome. Noise and hype… we’ll leave that to the Boone Pickens crowd. All I know is that the chart is the chart; it’s in a cyclical bear market within a secular bull.


Leave A Comment