
Since Friday, the USD Index extends increases and makes up for lost points. Looking at the daily chart you can even conclude that the bulls use every opportunity to push away their opponents from the recent lows. Why are they so important to them? We took a closer look at the situation and we already know the Achilles’ heel of the bulls. Do you also want to know it? We invite you to read today’s alert.
Focus on the USD Index
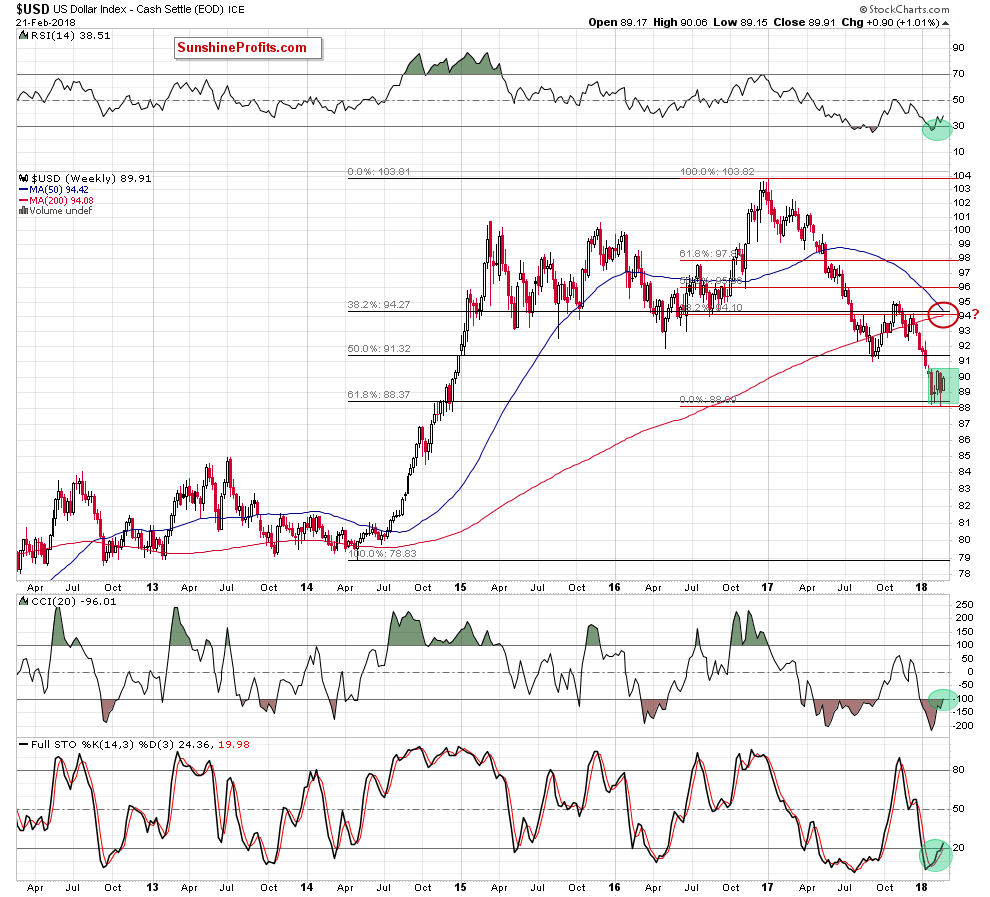
Before we analyze the recent changes in our currency pairs, we decided to take a closer look at the current situation in the USD Index as it is the key driver who generates the major changes on the currency market.
Let’s move back one month to the past (charts courtesy of http://stockcharts.com).
In our Forex Trading Alert posted on January 24, 2018, we wrote the following:
(…) if the support area around 89 doesn’t stop declines in the USD Index, the next downside target for the bears will be likely the 61.8% Fibonacci retracement (around 88.44) based on the entire 2014-2017 upward move).
From today’s point of view, we see that the situation developed in line with the above scenario and the USD Index slipped to our downside target on the following day. Although currency bulls triggered a rebound, the combination of resistances (we will write more about it a bit later) encouraged their opponents to fight once again, which resulted in a re-test of this key support.
Why this retracement is so important for the greenback? Let’s take a look at the long-term chart below to find out.

From this perspective, we see that this level/area is also reinforced by the 50% Fibonacci retracement based on the entire 2011-2017 upward move and the 200-month moving average.
This means that currency bears reached the most important fortress of the bulls and both opponents realize that if it is torn down, the road to the 2013 peaks and the next retracement will be open. With this in mind, it is not difficult to understand the increased involvement of the bulls in recent days.
Where did the last increases took the USD Index? Let’s examine the daily chart below.

Looking at the above chart, we see that the highlight of yesterday’s session (in terms of technical analysis) was the breakout above the short-term blue declining resistance line based on the mid-December 2017 and January 2018 peaks. It’s quite bullish development – especially when we factor in the fact that this resistance line stopped the bulls at the beginning of the month, triggering a reversal and declines to a fresh 2018 low.


Leave A Comment