
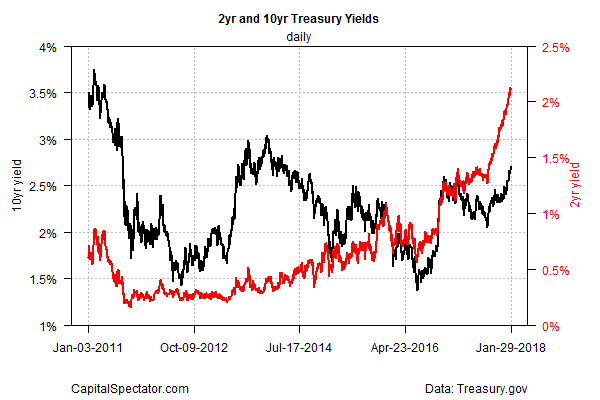
The benchmark 10-year rate yesterday (Jan. 30) jumped to 2.70% for the first time since 2014, based on daily data via Treasury.gov. One of the catalysts is firmer expectations for higher inflation. A weaker dollar is a factor too. Whatever the reason, the technical profile for the 10-year rate has recently shifted to an upside posture, signaling that the trend will continue.
“While the pace of the rise in yield in the short end of the yield curve isn’t that surprising since the Fed’s bias remains to tighten, what is more surprising is how quickly the yield on the 10-year note has shot up,” observed Kevin Giddis, head of fixed income capital markets at Raymond James. “It is almost as if the anticipation of inflation has been replaced with the certainty of it.”
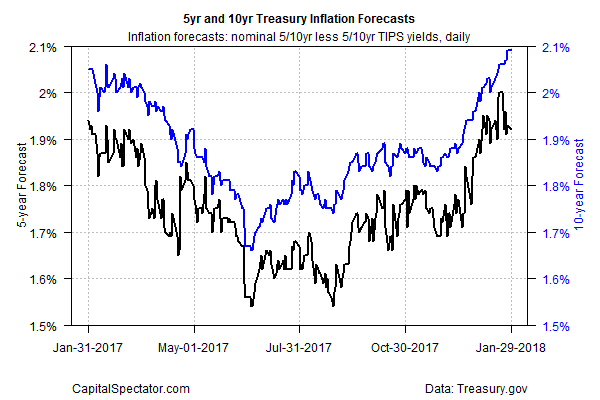
Indeed, the implied inflation forecast via the yield spread on the nominal 10-year Note less its inflation-indexed counterpart held at 2.09% on Monday for a second trading day – the highest level since Sep. 2014.
Some analysts point out that the recent slide in the dollar is stoking firmer expectations that US inflation will heat up this year. “While a weak dollar may boost economic momentum, it could also stoke inflation and force bond yields higher, which would be a headwind for the stock market,” wrote Lisa Shalett, head of investment and portfolio strategies at Morgan Stanley Investment Management, in a research note.
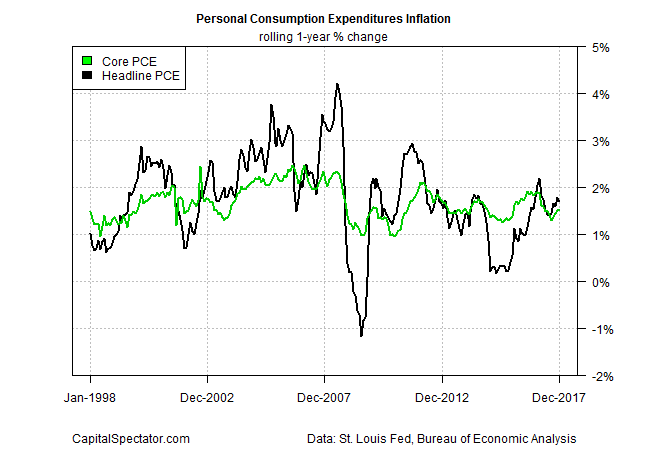
Official inflation rates, however, remain modest. Core PCE inflation, which the Federal Reserve monitors closely, held steady at a 1.5% annual pace, well below the central bank’s 2.0% target. Is that a sign that the Treasury market is getting ahead of itself and pricing in higher inflation that’s yet to show up in the hard data?
Perhaps, but for the moment the crowd is intent on repricing inflation risk, albeit on the margins and after an extended period of assuming that pricing pressure would remain weak. The recent jump in the 10-year yield has lifted the rate’s 50-day moving average sharply above its 100-day average, which is now well above the 200-day average. The transition in the technical profile marks a conspicuous change from the mixed trend in last year’s second half.


Leave A Comment