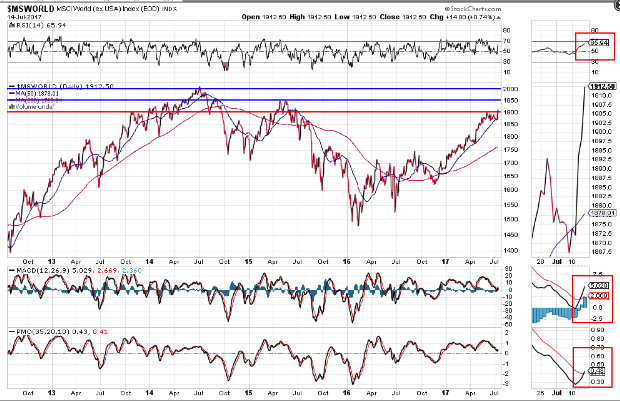
A new “BUY” signal has just triggered on the World Market Index. I last wrote about this index on June 29th.
Price punched through 1900 (which will now need to hold as major support), the RSI has broken its latest downtrend and is back above 50, and there are new bullish crossovers on the MACD and PMO indicators, as shown on the following Daily chart.

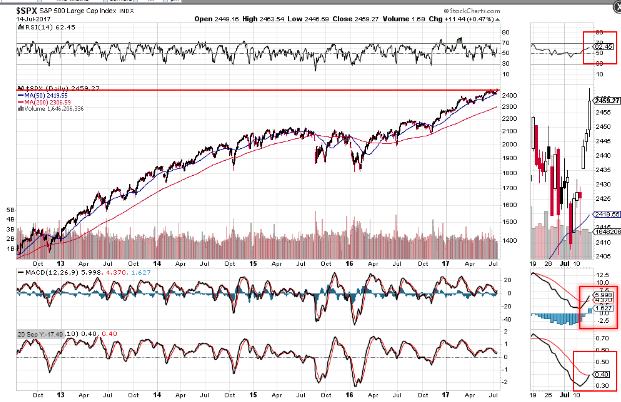
While the SPX has broken above near-term resistance of 2450 and closed at another all-time high, it’s a nano-breath away from also triggering a new “BUY” signal.
If price remains above 2450, if the RSI remains above 50, if the recent bullish crossover holds on the MACD, and if we get a bullish crossover on the PMO (imminent), we’ll see this trigger erupt, as shown on the Daily chart below.
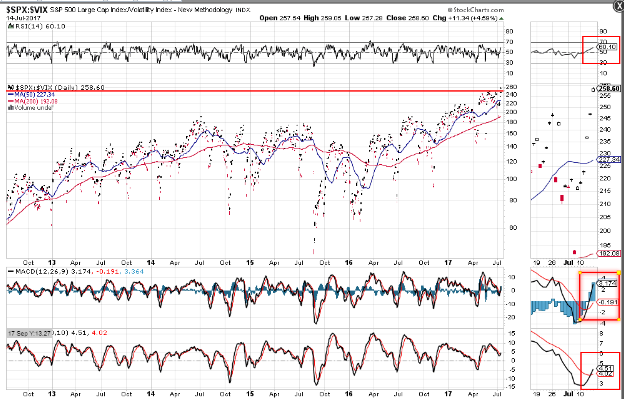
The SPX:VIX ratio has also broken above near-term resistance of 250 and closed at a new all-time high, as shown on the Daily ratio chart below.
Inasmuch as the RSI has broken its downtrend and is above 50, and bullish crossovers have formed on the MACD and PMO indicators, this ratio is confirming that a new “BUY” signal has triggered on the SPX. However, to see this through to fruition, we’ll need to see price remain above 250 and volatility remain at all-time lows.
The following 1-Year Daily chart grid of the 9 Major Sectors shows that Industrials and Materials are leading the pack, followed closely by Technology, Health Care, Cyclicals and Financials.
Utilities and Consumer Staples have slumped the past couple of months and Energy has been in a major downtrend all year. I’d keep a close watch on these three Sectors to see if buyers begin to dip their toes into these anytime soon.
If so, and, if the other six Sectors can hold their own, we will, no doubt, see more new records set in the SPX, with buying continuing in the World Market Index (the Year-to-date graph below shows that 8 of the 9 Sectors have decent to healthy gains, so far this year, while Energy is at -12.05%).


Leave A Comment