
Weekly Chart
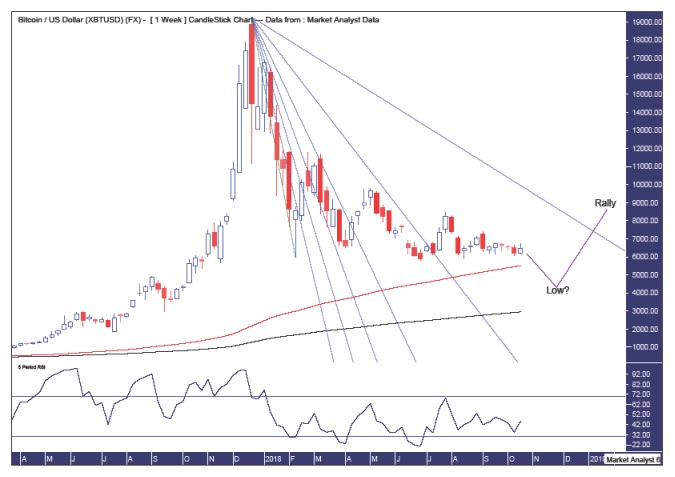
Pattern – the downtrend since the spike high looks to have slowed to crawl and I believe it can continue to drift lower.
Fibonacci – price has been making its way through the angles which is some consolation for the bulls. After trading a bit further down I believe price can rally and eventually crack above the 88.6% angle which may provide some temporary resistance.
Moving average – in a bullish position and these averages should provide support and perhaps a low will occur somewhere around these averages. Perhaps somewhere in between??
RSI – a bullish divergence will likely form at the coming low.
Monthly Chart
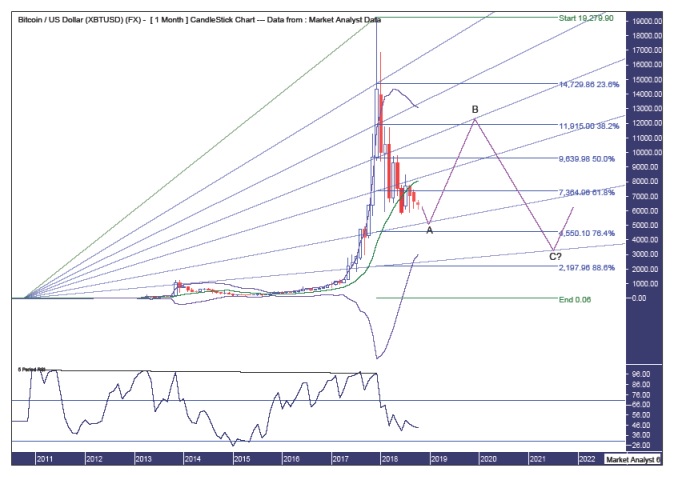
Pattern – I believe an ABC correction is in play with the final wave C low still a few years away. The move up into a wave B high will likely get the Bitcoin enthusiasts excited again and thinking a new massive bull trend is underway again. Not likely, in my opinion.
Bollinger Bands – price is now testing support from the middle band and I expect this support to kick in in the not too distant future, I doubt price will get down to the lower band on this move down. I favour the wave B high to be around resistance from the upper band with the final wave C low to be around support from the lower band. All in good time.
Fibonacci – I have used the all time low and high for this analysis and price is nearing some good support levels for a low being the 76.4% angle and the 76.4% retracement level at $4550. I favour the expected bear rally high (the wave B high) to get back up to around the 50% angle and the 38.2% retracement level at $11915. I favour the final wave C low to be around support from the 88.6% angle while the 88.6% retracement level at $2197 is not out of the question.
RSI – some major bearish divergences formed at the record high last year while this indicator is currently in weak territory and doesn’t look very promising from a bullish perspective.


Leave A Comment