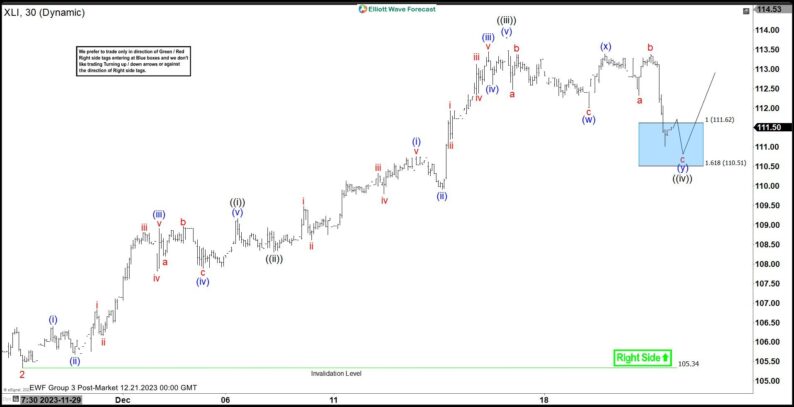
Hello fellow traders. In this technical article we’re going to take a quick look at the Elliott Wave charts of XLI ETF published in members area of the website. As our members know, XLI is showing bullish impulsive sequences in the cycle from the 96.1 low. Our team recommended members to avoid selling , while keep favoring the long side. Recently we got correction that reached our buying zone. The ETF found buyers and made reaction from the blue box as expected. In the further text we are going to explain the Elliott Wave Forecast and trading strategy.XLI Elliott Wave 1 Hour Chart 12.21.2023The ETF is giving us wave ((iv)) pull back that is unfolding as Double Three pattern. Pull back has already reached equal legs from the peak, blue box area. We expect buyers to appear at 111.62-110.51 for further rally or 3 waves bounce at least. We don’t recommend selling the ETF against the main bullish trend. Strategy is buying the dips at the marked extrme zone : 111.62-110.51 . Once bounce reaches 50 Fibs against the (x) blue high , we will make long position risk free ( put SL at BE) and take partial profits. Invalidation for the long trades is break of 1.618 fib ext : 110.51 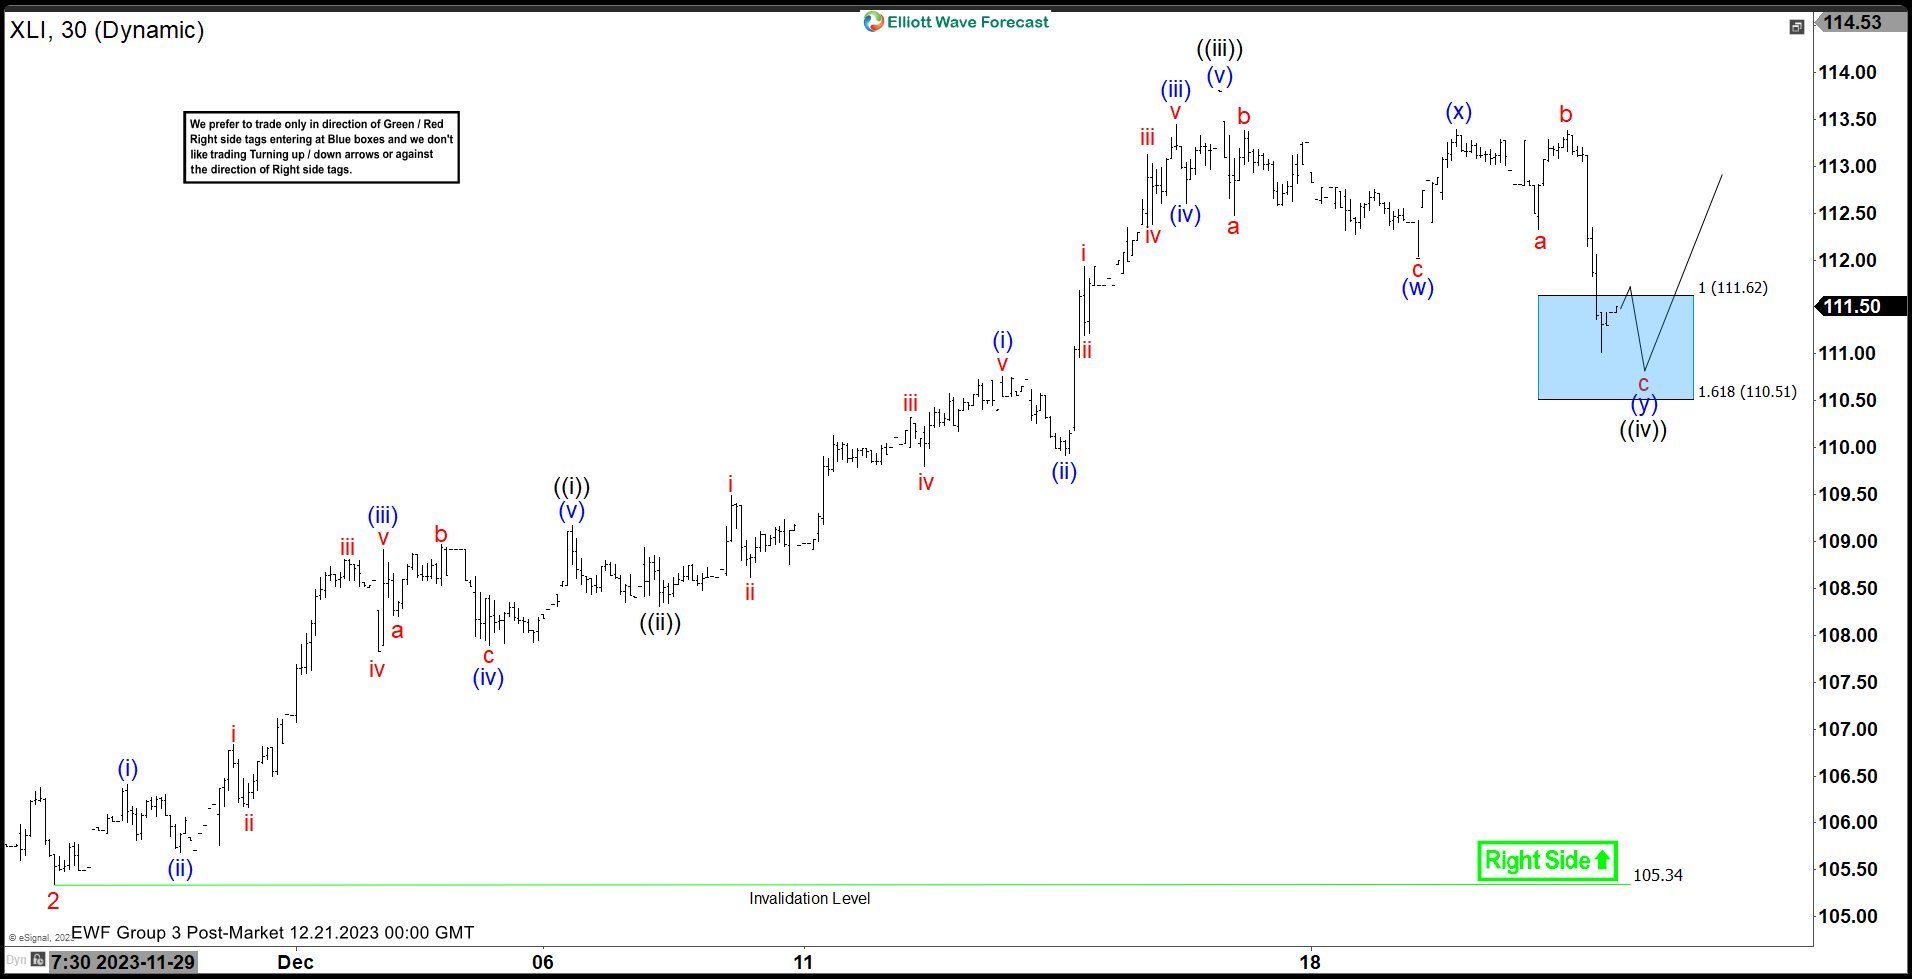 XLI Elliott Wave 1 Hour Chart 12.24.2023XLI found buyers at the blue box as expected and we got good reaction from there. Bounce already reached and exceeded 50 fibs against the ((x)) black connector which confirms cycle from the peak is done. Consequently, any long positions from the equal legs area should be risk free by now. We count pull back completed at the 111.13 low, but would like to see break above 3 red peak to confirm. As far as the price stays above 111.13low, we can see further strength in XLI, targeting 114.49+ area.
  More By This Author:Costco Wholesale Continues Upside In Bullish SequenceFord Entered In A Double Three Structure To The Downside AMD Looking For One More Leg Higher To Complete An Impulse Structure


Leave A Comment