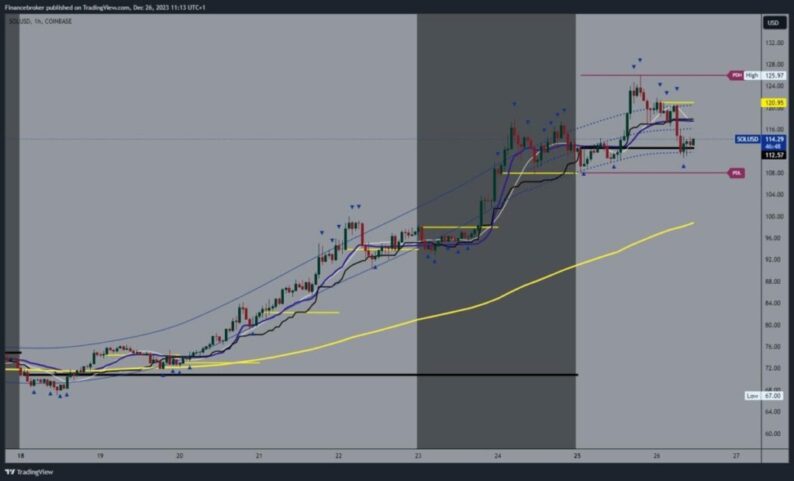
Solana chart analysisThe price of Solana continues its bullish trend, rising to 125.97 levels yesterday. On the chart of Solana, we do not see the volatility of other cryptocurrencies. After forming yesterday’s high, the price returned to the 110.00 level, looking for that support. She succeeded in that and slightly recovered to the 115.00 level. Now, we need a new impulse to start a bullish consolidation. Potential higher targets are 120.00 and 124.00 levels.For a bearish option, we need a break below the 108.00 level. With that, we would retreat below this week’s low and confirm the bearish presence on the chart. Potential lower targets are 104.00 and 100.00 levels. EMA50 moving average is in the zone around 100.00 levels. 
Cardano chart analysis
Today, we see a pullback in the Cardano price from the 0.635 level to the 0.600 level. The price is making a break below the EMA50 moving average, but we are now back above and trying to get a break below the EMA50. If we succeed in this, we will see a positive consolidation and the rise of the price of Cardano to higher levels. Potential higher targets are 0.620 and 0.630 levels.For a bearish option, we need a return below the EMA50 and a new test of the 0.600 level. A break below would take us down to yesterday’s low at 0.590. The inability to hold above it leads to a pullback below and the formation of a new low. Potential lower targets are 0.580 and 0.570 levels. Last week’s low price of Cardano was at the 0.544 level. 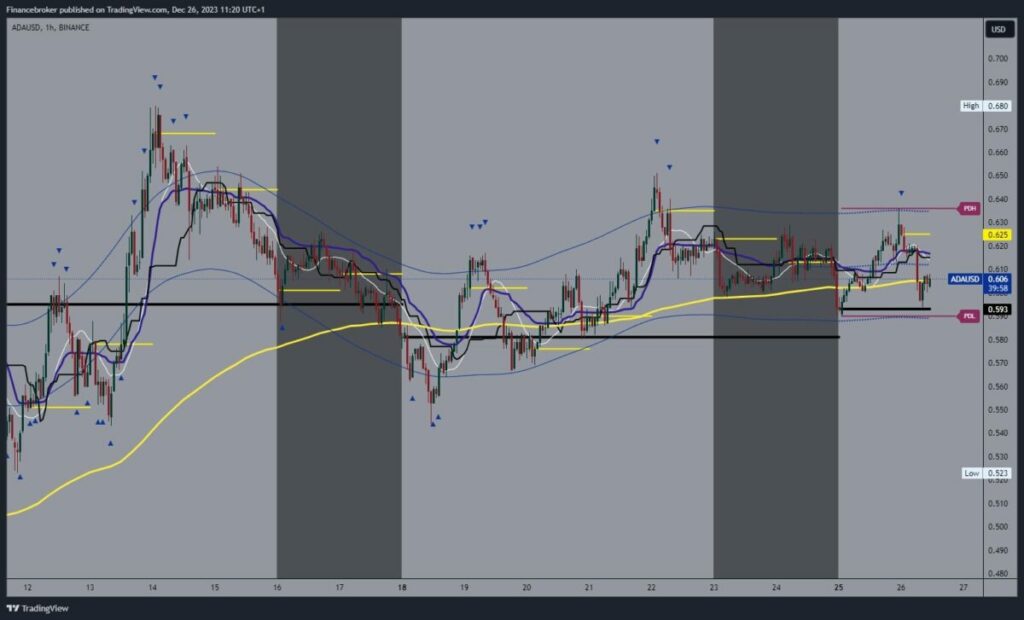 More By This Author:Dogecoin And Shiba Inu: Shiba Inu Is Testing The Ema50 Bitcoin And Ethereum: Bitcoin Slips Below $43000 Level Asian Market Rally: Insights From A Year-End Surge


Leave A Comment