Ripple is on fire, enjoying a spectacular recovery. There are three levels for the 40% jump, and the move may not be over just yet. What levels should we watch?
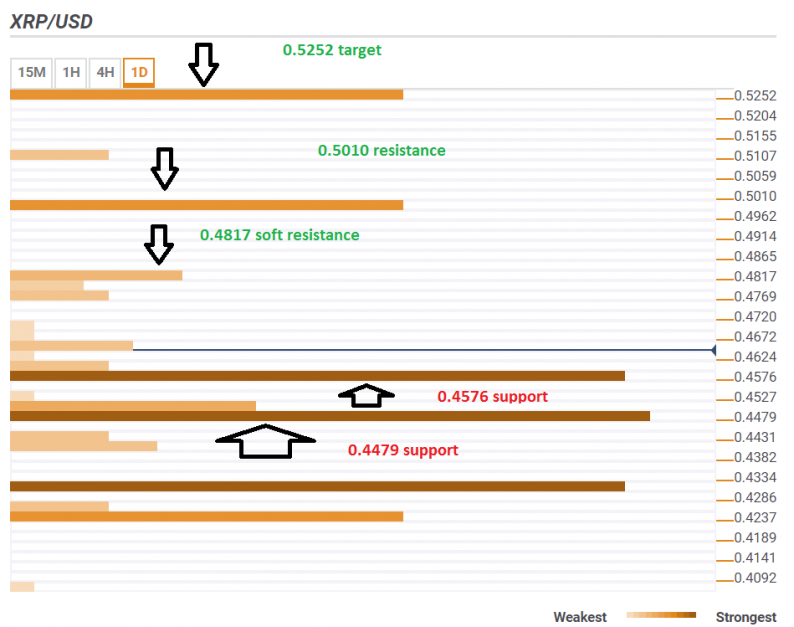
The Technical Confluence Indicator shows that an initial target is at $0.4817 which is the convergence of the four-hour high, the Bolinger Band 15-Upper, and the 1h-high. However, this is a weak line of resistance.
The next level to watch is $ 0.4985, just under the round fifty cent level, where we note the one-day high. The top target is $ 0.5252 which is the Pivot Point one-day Resistance 1.
Looking down, robust support awaits at $ 0.4576 which is the confluence of two considerable technical lines: the Bolinger Band 4h-Upper and the Fibonacci 23.6% one-day.
Another cushion is at $ 0.4479 where we see the Pivot Point one-month Resistance 1, the BB 15m-Lower and the Simple Moving Average 50-15m.
All in all, the path of least resistance is up. Support is stronger than resistance.
Here is how it looks on the tool:

The Confluence Detector finds exciting opportunities using Technical Confluences. The TC is a tool to locate and point out those price levels where there is a congestion of indicators, moving averages, Fibonacci levels, Pivot Points, etc. Knowing where these congestion points are located is very useful for the trader, and can be used as a basis for different strategies.


Leave A Comment