

With the market now back to overbought conditions, it is now or never for the traditional “Santa Rally” between Christmas and New Year’s Day.
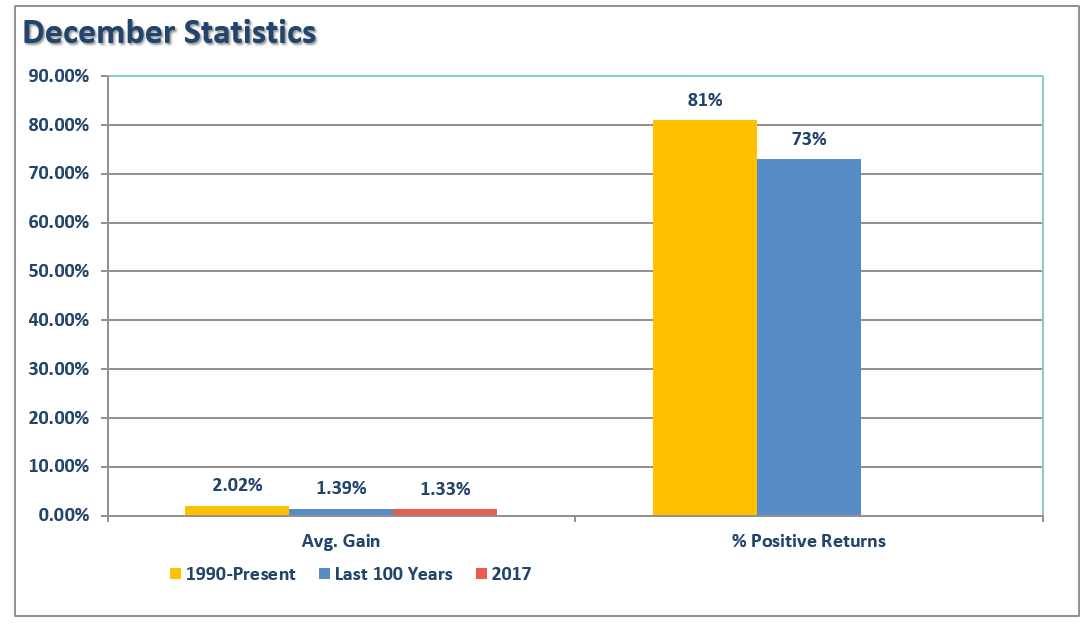
If we go back to 1990, the month of December has had average returns of 2.02% with positive returns 81% of the time. Over the past 100 years, those numbers fall slightly to a 1.39% average return with positive returns 73% of the time.
For the month of December, so far, the market has risen 1.33% which is in-line with the historical norm.
As discussed over the last couple of weeks, this is not to be unexpected as portfolio managers and hedge funds “Stuff Their Stockings” of highly visible positions to have them reflected in year-end statements.
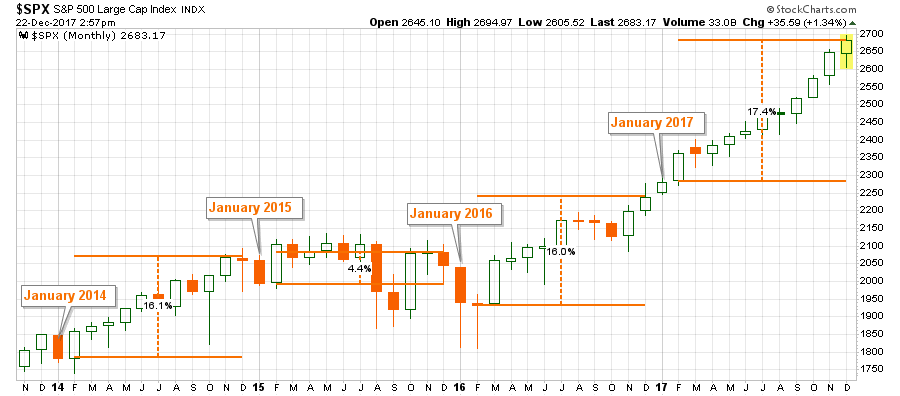
However, come January, it is potentially a different story. As I have been laying out over the last several weeks, the “tax cut” rally may well come to an end as portfolio managers, being reluctant to sell before year-end which would put them under the 2017 tax code, will likely sell in January to lock in gains under the new tax code when they pay taxes in 2019.
While “this time” is never exactly like the “last time,” there is a reasonable precedent that a sell-off in January is a likelihood. With the outside gains this past year, and now extreme overbought conditions as discussed last week, the odds of a correction are high.
This next week, as close to the end of the year as possible, we will likely be adding two positions to portfolios to hedge against a potential “tax gain” related sell off.The first position will be a short-S&P 500 index combined with an intermediate-duration bond position.
Given that IF a sell-off occurs money will rotate from “risk” to “safety.” In this case, the S&P 500 should fall while bond prices rise as rates head lower. As shown below, with the stock-bond ratio at extremes, this trade is fairly low risk.


Leave A Comment